Key Stats
How many ATS-L did Cadillac sell in March 2020?
Cadillac sold -2 ATS-L in March 2020.
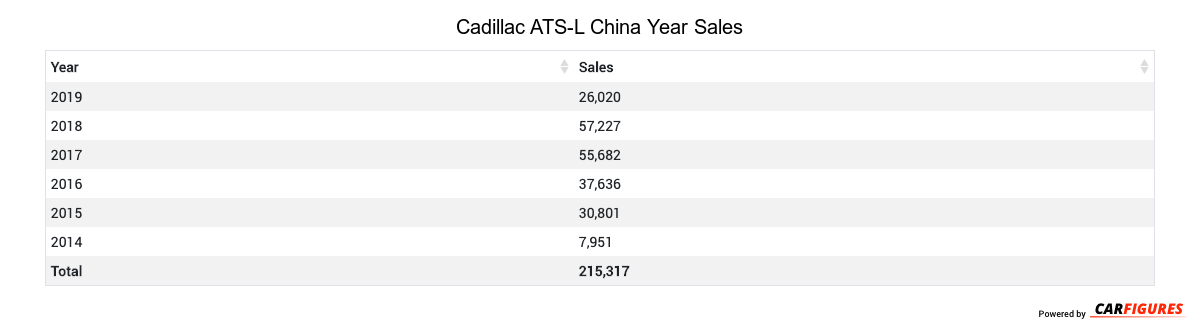
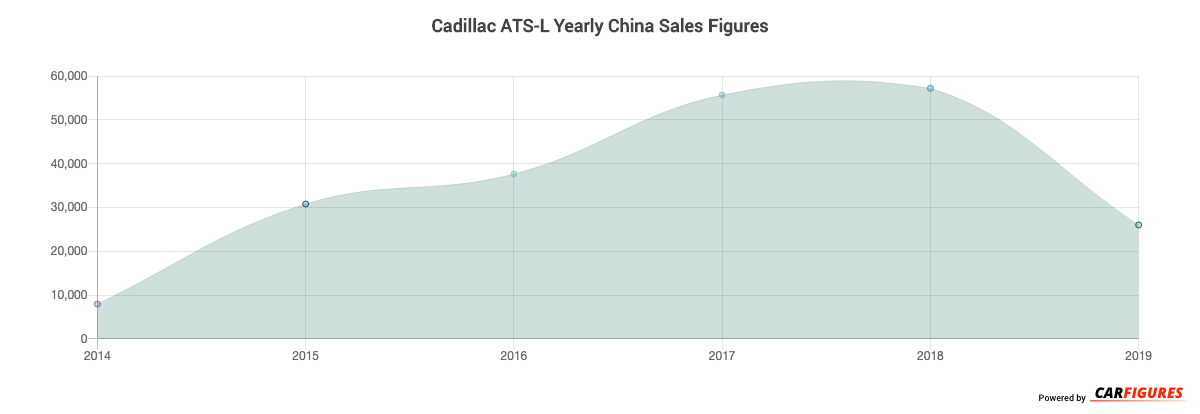
How many ATS-L did Cadillac sell in 2019?
Cadillac sold 26,020 ATS-L in 2019. In 2018, Cadillac sold 57,227 ATS-L. They sold 31,207 more units in year 2018 compared to 2019 with a percent loss of 54.53% YoY.
Overview
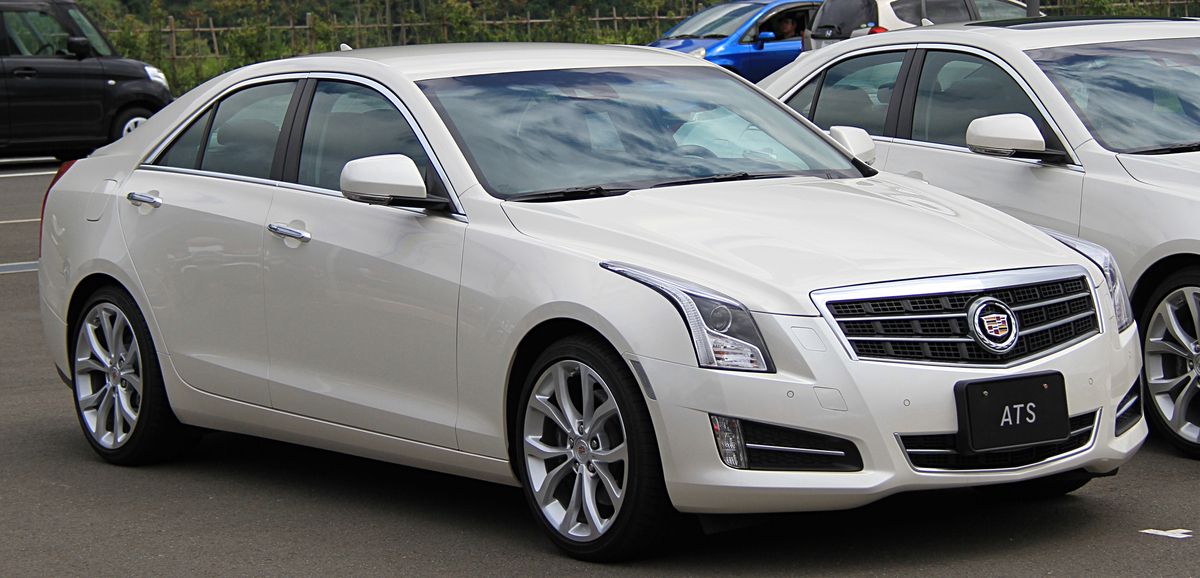
The ATS-L is a 4-door 5-seater sedan with room for 5 people.
How Much Does the Cadillac ATS-L Cost?
The ATS-L starts at CN¥298,800 Yuan ($41,832 USD) MSRP. Fully equipped, the ATS-L will cost you about CN¥428,800 Yuan ($60,032 USD).
Cadillac ATS-L Engine and Performance
ATS-L is powered by a 2.0TL engine that makes 205 Kw (274.91 HP) - 205 Kw (274.91 HP) and 400 Nm (296.00 ft-lb) - 400 Nm (296.00 ft-lb) torque.
Cadillac ATS-L Specifications
The ATS-L has a curb weight of 1,600 kg (3,500 lbs) - 1,600 kg (3,500 lbs).
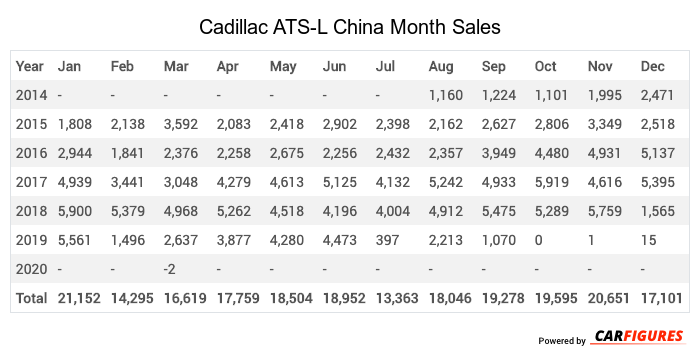
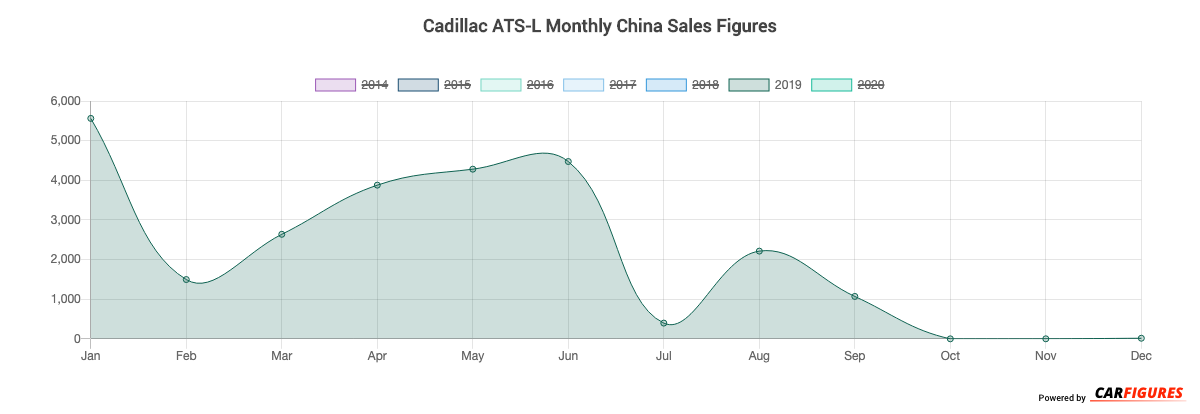
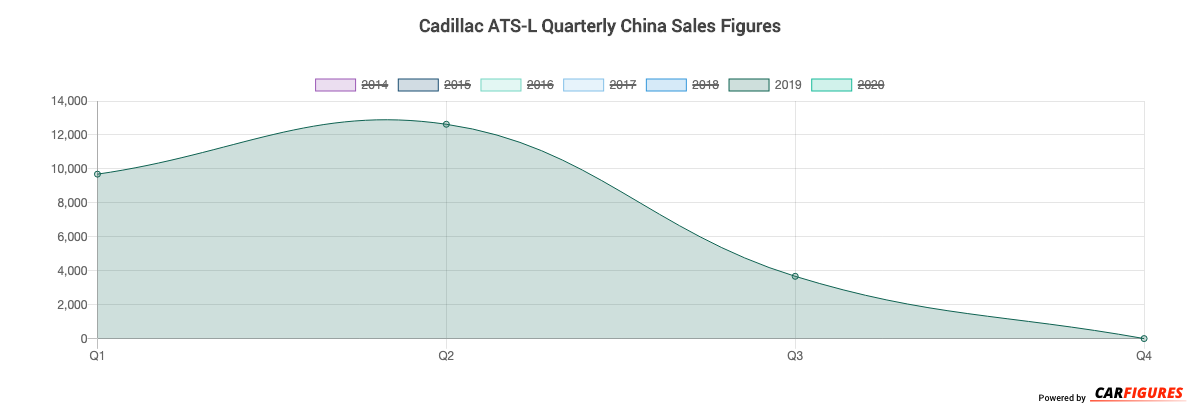
Cadillac ATS-L China Sale figures by year, quarter, and month are presented below. Including the most up to date sales data for the Cadillac ATS-L.
Year | Jan | Feb | Mar | Apr | May | Jun | Jul | Aug | Sep | Oct | Nov | Dec |
|---|---|---|---|---|---|---|---|---|---|---|---|---|
| 2014 | - | - | - | - | - | - | - | 1,160 | 1,224 | 1,101 | 1,995 | 2,471 |
| 2015 | 1,808 | 2,138 | 3,592 | 2,083 | 2,418 | 2,902 | 2,398 | 2,162 | 2,627 | 2,806 | 3,349 | 2,518 |
| 2016 | 2,944 | 1,841 | 2,376 | 2,258 | 2,675 | 2,256 | 2,432 | 2,357 | 3,949 | 4,480 | 4,931 | 5,137 |
| 2017 | 4,939 | 3,441 | 3,048 | 4,279 | 4,613 | 5,125 | 4,132 | 5,242 | 4,933 | 5,919 | 4,616 | 5,395 |
| 2018 | 5,900 | 5,379 | 4,968 | 5,262 | 4,518 | 4,196 | 4,004 | 4,912 | 5,475 | 5,289 | 5,759 | 1,565 |
| 2019 | 5,561 | 1,496 | 2,637 | 3,877 | 4,280 | 4,473 | 397 | 2,213 | 1,070 | 0 | 1 | 15 |
| 2020 | - | - | -2 | - | - | - | - | - | - | - | - | - |
| Total | 21,152 | 14,295 | 16,619 | 17,759 | 18,504 | 18,952 | 13,363 | 18,046 | 19,278 | 19,595 | 20,651 | 17,101 |
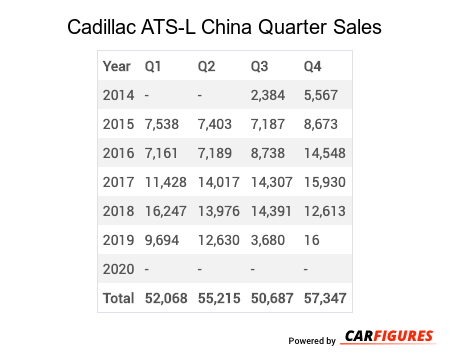
Year | Q1 | Q2 | Q3 | Q4 |
|---|---|---|---|---|
| 2014 | - | - | 2,384 | 5,567 |
| 2015 | 7,538 | 7,403 | 7,187 | 8,673 |
| 2016 | 7,161 | 7,189 | 8,738 | 14,548 |
| 2017 | 11,428 | 14,017 | 14,307 | 15,930 |
| 2018 | 16,247 | 13,976 | 14,391 | 12,613 |
| 2019 | 9,694 | 12,630 | 3,680 | 16 |
| 2020 | - | - | - | - |
| Total | 52,068 | 55,215 | 50,687 | 57,347 |
Year | Sales |
|---|---|
| 2019 | 26,020 |
| 2018 | 57,227 |
| 2017 | 55,682 |
| 2016 | 37,636 |
| 2015 | 30,801 |
| 2014 | 7,951 |
| Total | 215,317 |
Download Historic Sales Data
Embedded Code
See more widgetsSources: Manufacturers