Key Stats
How many Excelle GT did Buick sell in 2020?
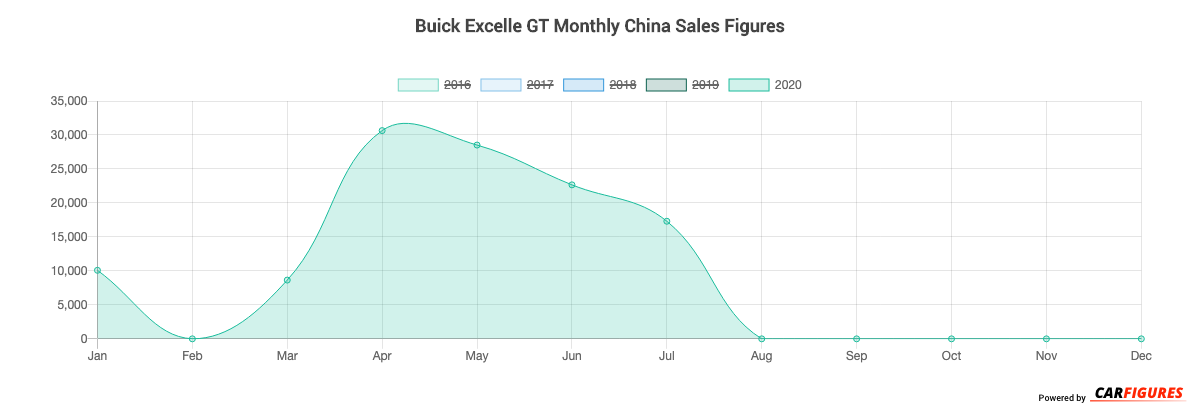
Buick sold 117,855 Excelle GT in 2020. (From Jan - Dec 2020)
How many Excelle GT did Buick sell in July 2020?
Buick sold 17,305 Excelle GT in July 2020.
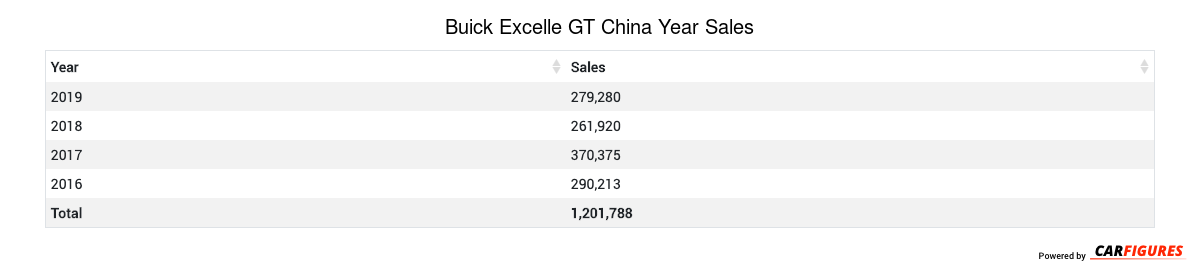
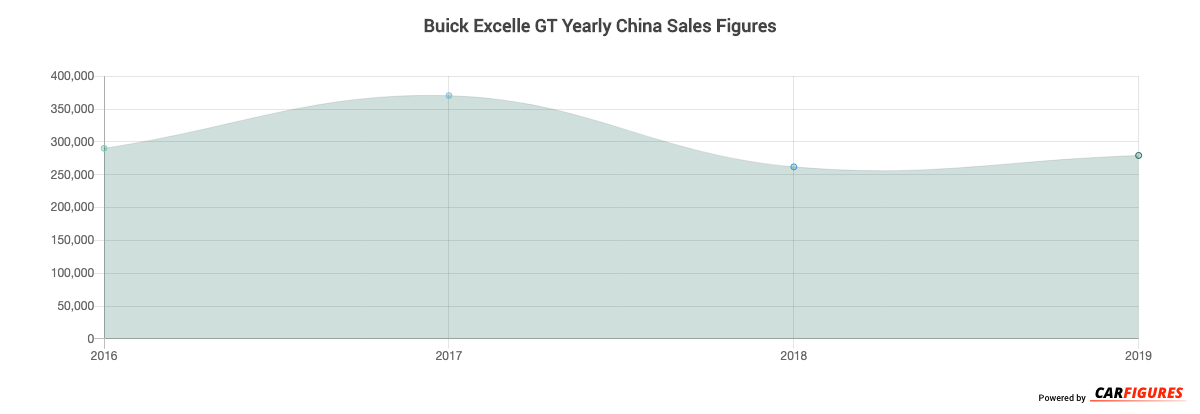
How many Excelle GT did Buick sell in 2019?
Buick sold 279,280 Excelle GT in 2019. In 2018, Buick sold 261,920 Excelle GT. They sold 17,360 more units in 2019 compared to 2018 with a percent gain of 6.63% YoY.
Overview
The Excelle GT is a 4-door 5-seater sedan with room for 5 people.
How Much Does the Buick Excelle GT Cost?
The Excelle GT starts at CN¥116,900 Yuan ($16,366 USD) MSRP. Fully equipped, the Excelle GT will cost you about CN¥144,900 Yuan ($20,286 USD).
Buick Excelle GT Engine and Performance
Excelle GT is powered by a 1.0TL engine that makes 92 Kw (123.37 HP) - 120 Kw (160.92 HP) and 170 Nm (125.80 ft-lb) - 230 Nm (170.20 ft-lb) torque.
Buick Excelle GT Specifications
The Excelle GT has a curb weight of 1,200 kg (2,700 lbs) - 1,300 kg (2,800 lbs).
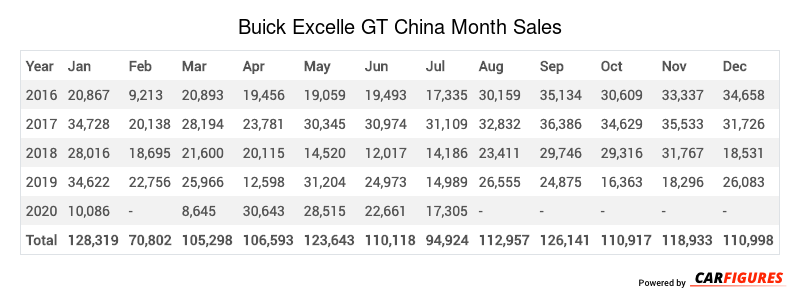
Buick Excelle GT China Sale figures by year, quarter, and month are presented below. Including the most up to date sales data for the Buick Excelle GT.
| Year | Jan | Feb | Mar | Apr | May | Jun | Jul | Aug | Sep | Oct | Nov | Dec |
|---|---|---|---|---|---|---|---|---|---|---|---|---|
| 2016 | 20867 | 9213 | 20893 | 19456 | 19059 | 19493 | 17335 | 30159 | 35134 | 30609 | 33337 | 34658 |
| 2017 | 34728 | 20138 | 28194 | 23781 | 30345 | 30974 | 31109 | 32832 | 36386 | 34629 | 35533 | 31726 |
| 2018 | 28016 | 18695 | 21600 | 20115 | 14520 | 12017 | 14186 | 23411 | 29746 | 29316 | 31767 | 18531 |
| 2019 | 34622 | 22756 | 25966 | 12598 | 31204 | 24973 | 14989 | 26555 | 24875 | 16363 | 18296 | 26083 |
| 2020 | 10086 | - | 8645 | 30643 | 28515 | 22661 | 17305 | - | - | - | - | - |
| Total | 128319 | 70802 | 105298 | 106593 | 123643 | 110118 | 94924 | 112957 | 126141 | 110917 | 118933 | 110998 |
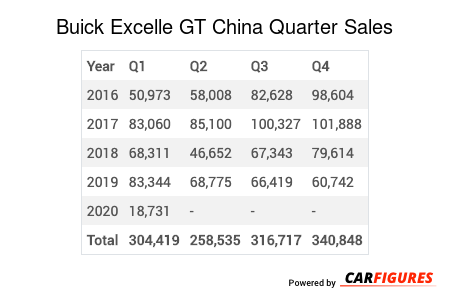
| Year | Q1 | Q2 | Q3 | Q4 |
|---|---|---|---|---|
| 2016 | 50973 | 58008 | 82628 | 98604 |
| 2017 | 83060 | 85100 | 100327 | 101888 |
| 2018 | 68311 | 46652 | 67343 | 79614 |
| 2019 | 83344 | 68775 | 66419 | 60742 |
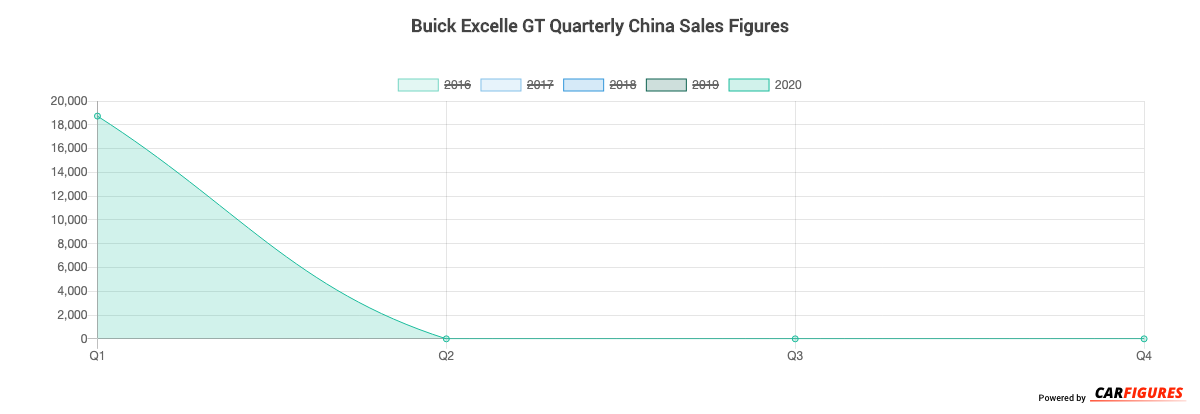
| 2020 | 18731 | - | - | - |
| Total | 304419 | 258535 | 316717 | 340848 |
| Year | Sales |
|---|---|
| 2020 | 18731 |
| 2019 | 279280 |
| 2018 | 261920 |
| 2017 | 370375 |
| 2016 | 290213 |
| Total | 1220519 |
Download Historic Sales Data
Embedded Code
See more widgetsSources: Manufacturers