Key Stats
How many Q3 did Audi sell in 2020?
Audi sold 38,889 Q3 in 2020. (From Jan - Dec 2020)
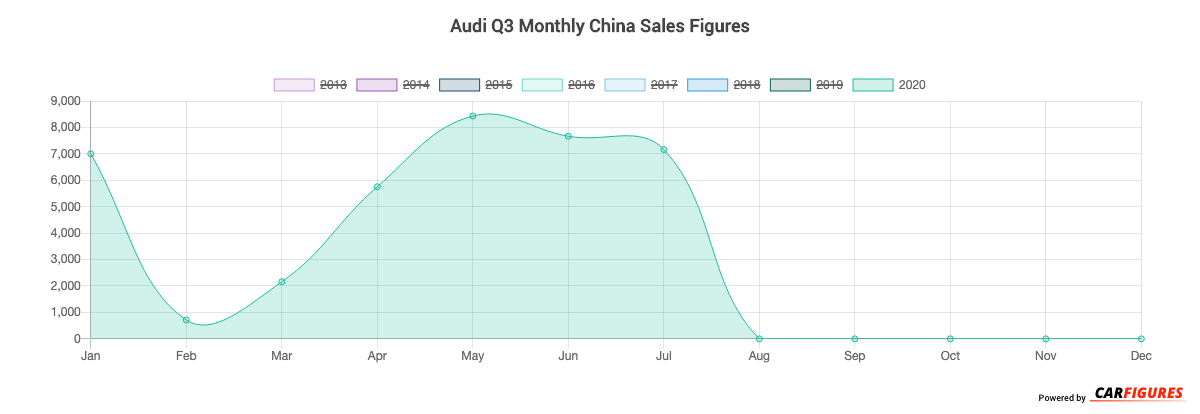
How many Q3 did Audi sell in July 2020?
Audi sold 7,164 Q3 in July 2020.
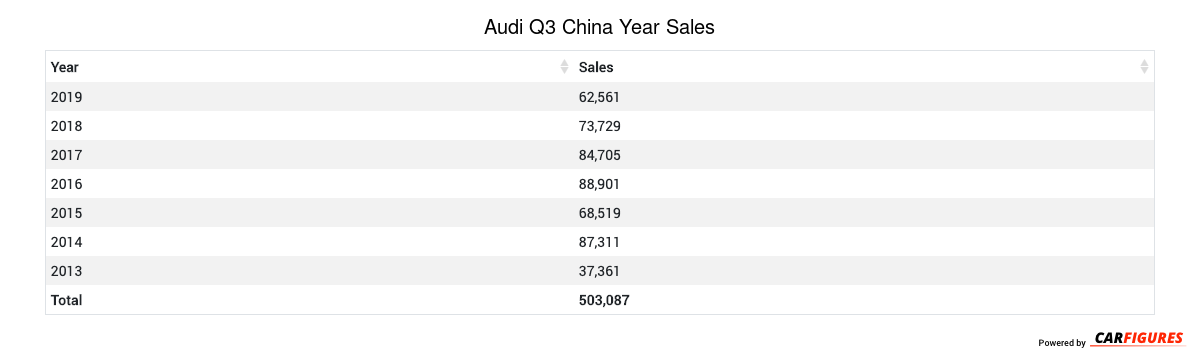
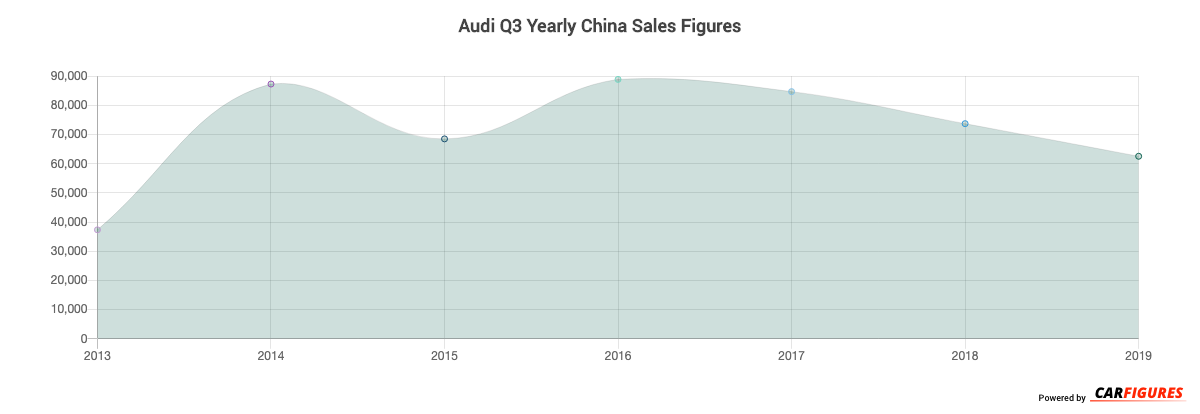
How many Q3 did Audi sell in 2019?
Audi sold 62,561 Q3 in 2019. In 2018, Audi sold 73,729 Q3. They sold 11,168 more units in year 2018 compared to 2019 with a percent loss of 15.15% YoY.
Overview
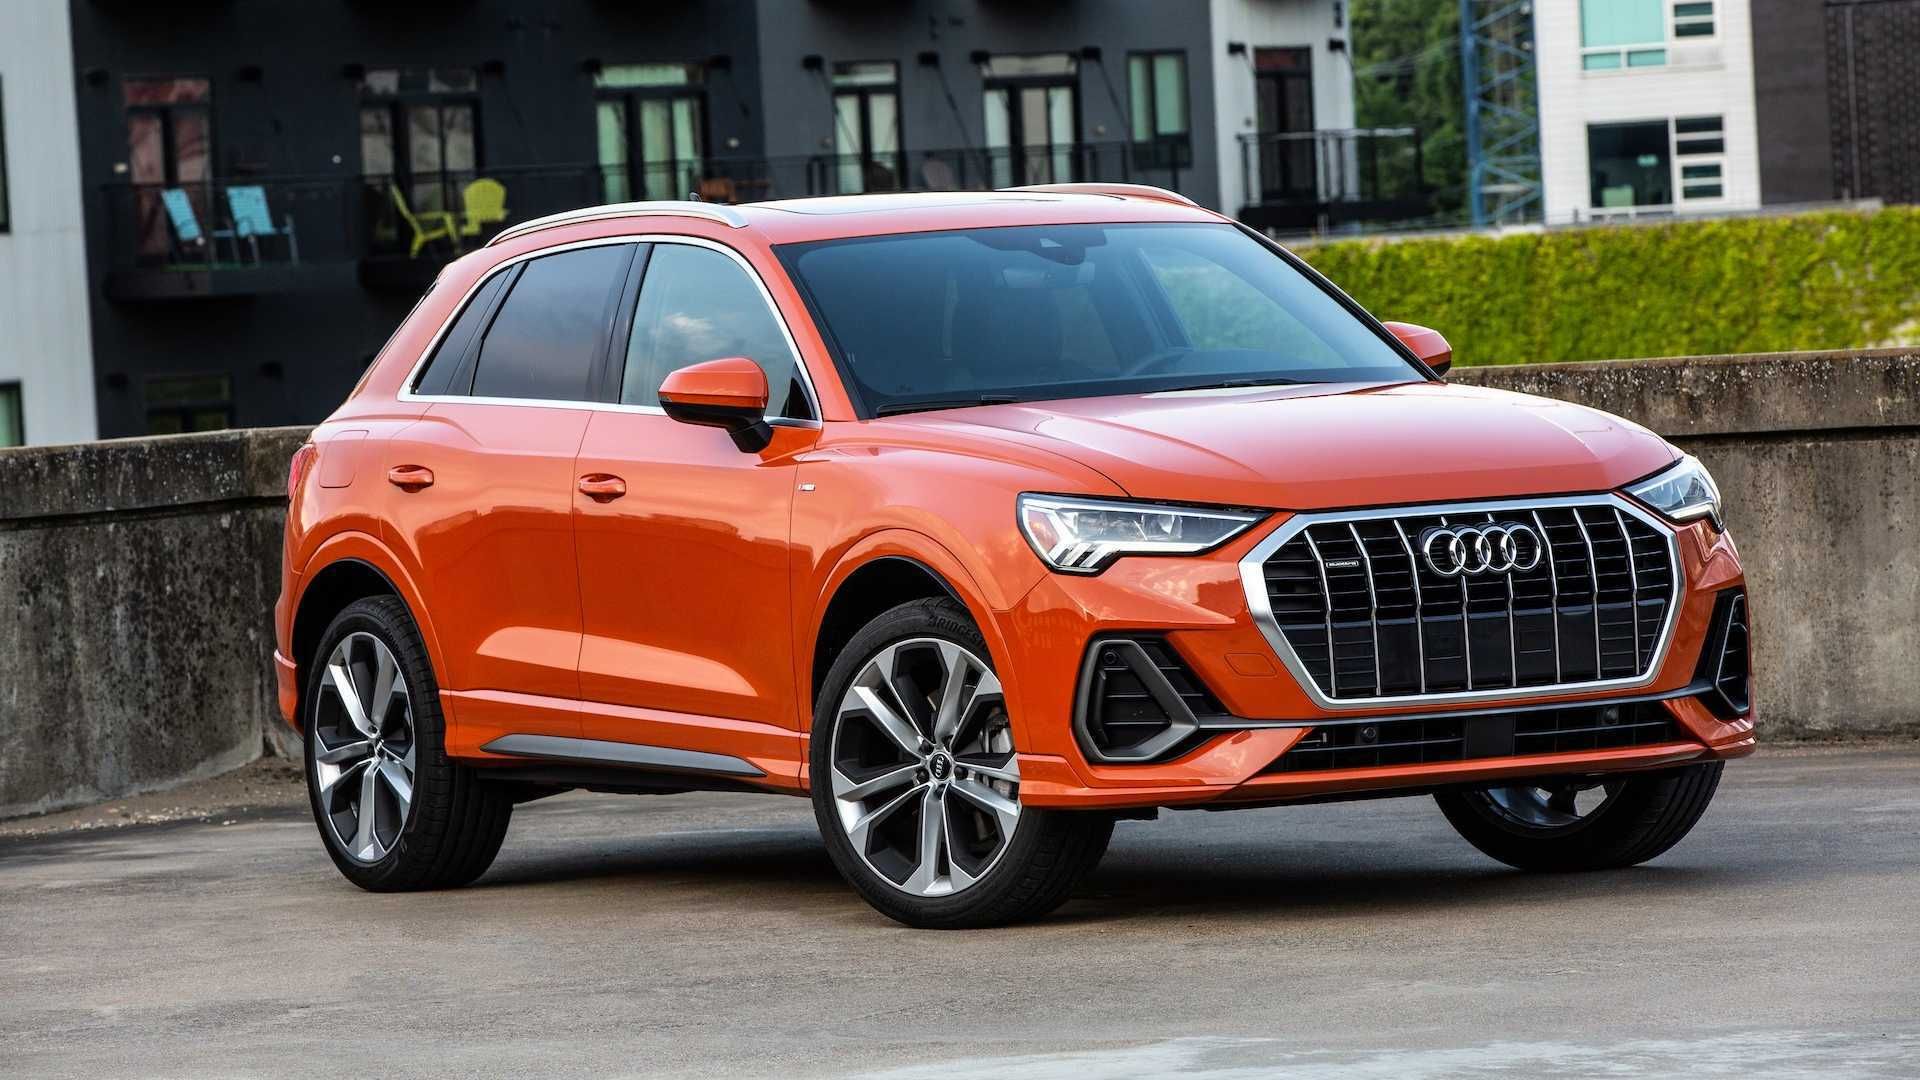
The Q3 is a 5 doors 5 seats SUV with room for 5 people from automaker Audi.
How Much Does the Audi Q3 Cost?
Pricing for the Q3 starts at CN¥271,800 Yuan ($38,052 USD) MSRP and goes up to CN¥359,800 Yuan ($50,372 USD) fully equipped.
Audi Q3 Engine and Performance
Q3 includes a 1.4T L engine. This delivers 110 Kw (147.51 HP) - 162 Kw (217.25 HP) and 250 Nm (185.00 ft-lb) - 350 Nm (259.00 ft-lb) torque.
Audi Q3 Specifications
The Q3 has a curb weight of 1,600 kg (3,500 lbs) - 1,700 kg (3,800 lbs).
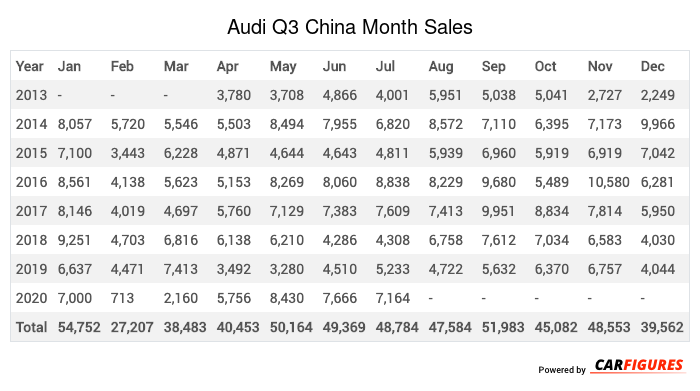
Audi Q3 China Sale figures by year, quarter, and month are presented below. Including the most up to date sales data for the Audi Q3.
Year | Jan | Feb | Mar | Apr | May | Jun | Jul | Aug | Sep | Oct | Nov | Dec |
|---|---|---|---|---|---|---|---|---|---|---|---|---|
| 2013 | - | - | - | 3,780 | 3,708 | 4,866 | 4,001 | 5,951 | 5,038 | 5,041 | 2,727 | 2,249 |
| 2014 | 8,057 | 5,720 | 5,546 | 5,503 | 8,494 | 7,955 | 6,820 | 8,572 | 7,110 | 6,395 | 7,173 | 9,966 |
| 2015 | 7,100 | 3,443 | 6,228 | 4,871 | 4,644 | 4,643 | 4,811 | 5,939 | 6,960 | 5,919 | 6,919 | 7,042 |
| 2016 | 8,561 | 4,138 | 5,623 | 5,153 | 8,269 | 8,060 | 8,838 | 8,229 | 9,680 | 5,489 | 10,580 | 6,281 |
| 2017 | 8,146 | 4,019 | 4,697 | 5,760 | 7,129 | 7,383 | 7,609 | 7,413 | 9,951 | 8,834 | 7,814 | 5,950 |
| 2018 | 9,251 | 4,703 | 6,816 | 6,138 | 6,210 | 4,286 | 4,308 | 6,758 | 7,612 | 7,034 | 6,583 | 4,030 |
| 2019 | 6,637 | 4,471 | 7,413 | 3,492 | 3,280 | 4,510 | 5,233 | 4,722 | 5,632 | 6,370 | 6,757 | 4,044 |
| 2020 | 7,000 | 713 | 2,160 | 5,756 | 8,430 | 7,666 | 7,164 | - | - | - | - | - |
| Total | 54,752 | 27,207 | 38,483 | 40,453 | 50,164 | 49,369 | 48,784 | 47,584 | 51,983 | 45,082 | 48,553 | 39,562 |
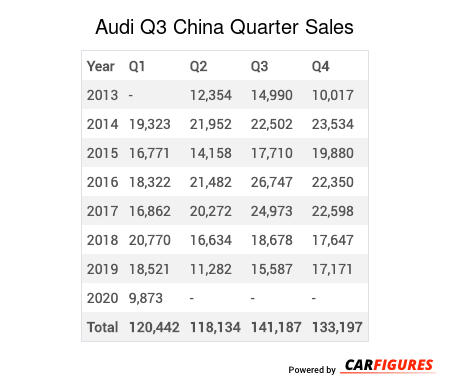
Year | Q1 | Q2 | Q3 | Q4 |
|---|---|---|---|---|
| 2013 | - | 12,354 | 14,990 | 10,017 |
| 2014 | 19,323 | 21,952 | 22,502 | 23,534 |
| 2015 | 16,771 | 14,158 | 17,710 | 19,880 |
| 2016 | 18,322 | 21,482 | 26,747 | 22,350 |
| 2017 | 16,862 | 20,272 | 24,973 | 22,598 |
| 2018 | 20,770 | 16,634 | 18,678 | 17,647 |
| 2019 | 18,521 | 11,282 | 15,587 | 17,171 |
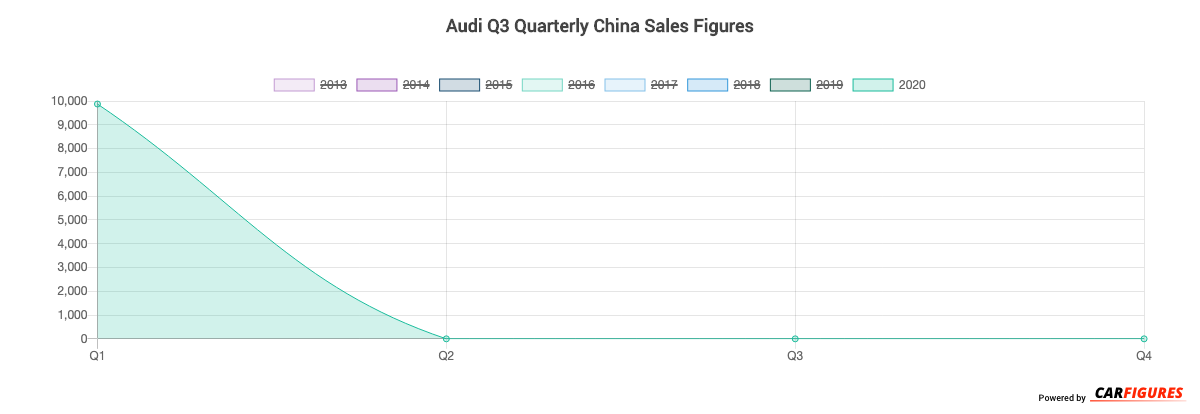
| 2020 | 9,873 | - | - | - |
| Total | 120,442 | 118,134 | 141,187 | 133,197 |
Year | Sales |
|---|---|
| 2020 | 9,873 |
| 2019 | 62,561 |
| 2018 | 73,729 |
| 2017 | 84,705 |
| 2016 | 88,901 |
| 2015 | 68,519 |
| 2014 | 87,311 |
| 2013 | 37,361 |
| Total | 512,960 |
Download Historic Sales Data
Embedded Code
See more widgetsSources: Manufacturers