Key Stats
How many A6L did Audi sell in 2020?
Audi sold 89,043 A6L in 2020. (From Jan - Dec 2020)
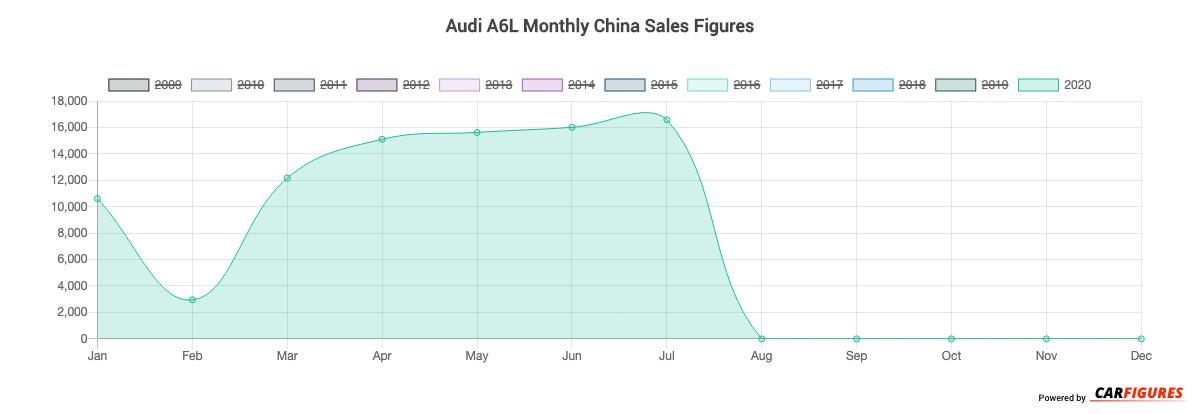
How many A6L did Audi sell in July 2020?
Audi sold 16,586 A6L in July 2020.
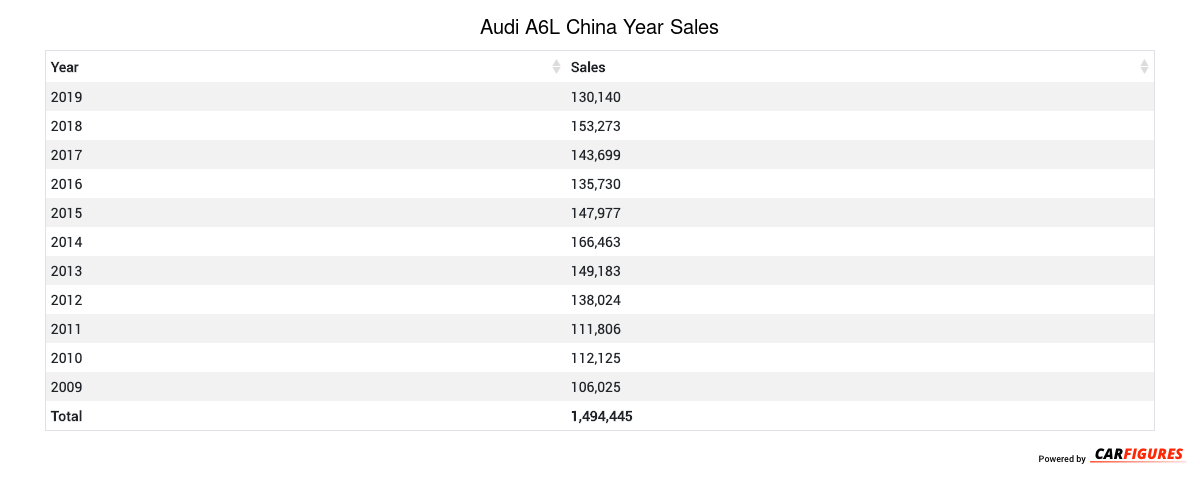
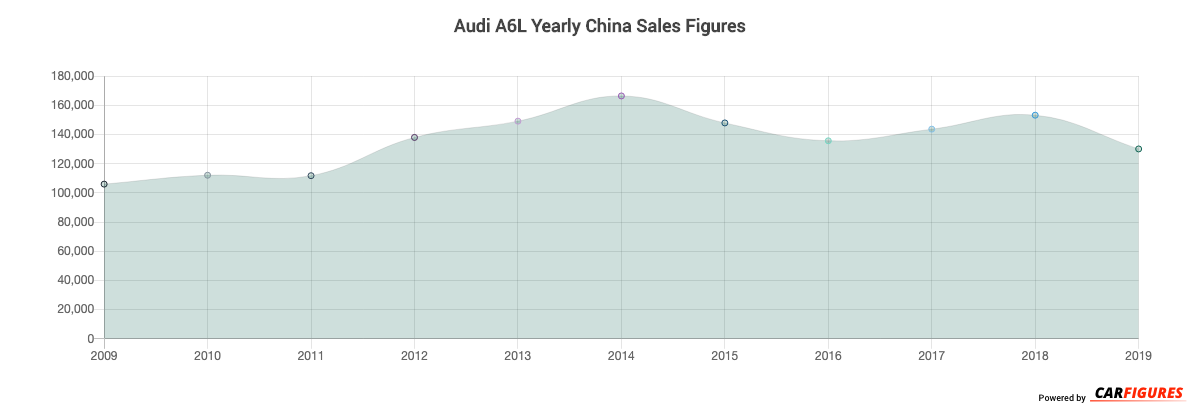
How many A6L did Audi sell in 2019?
Audi sold 130,140 A6L in 2019. In 2018, Audi sold 153,273 A6L. They sold 23,133 more units in year 2018 compared to 2019 with a percent loss of 15.09% YoY.
Overview
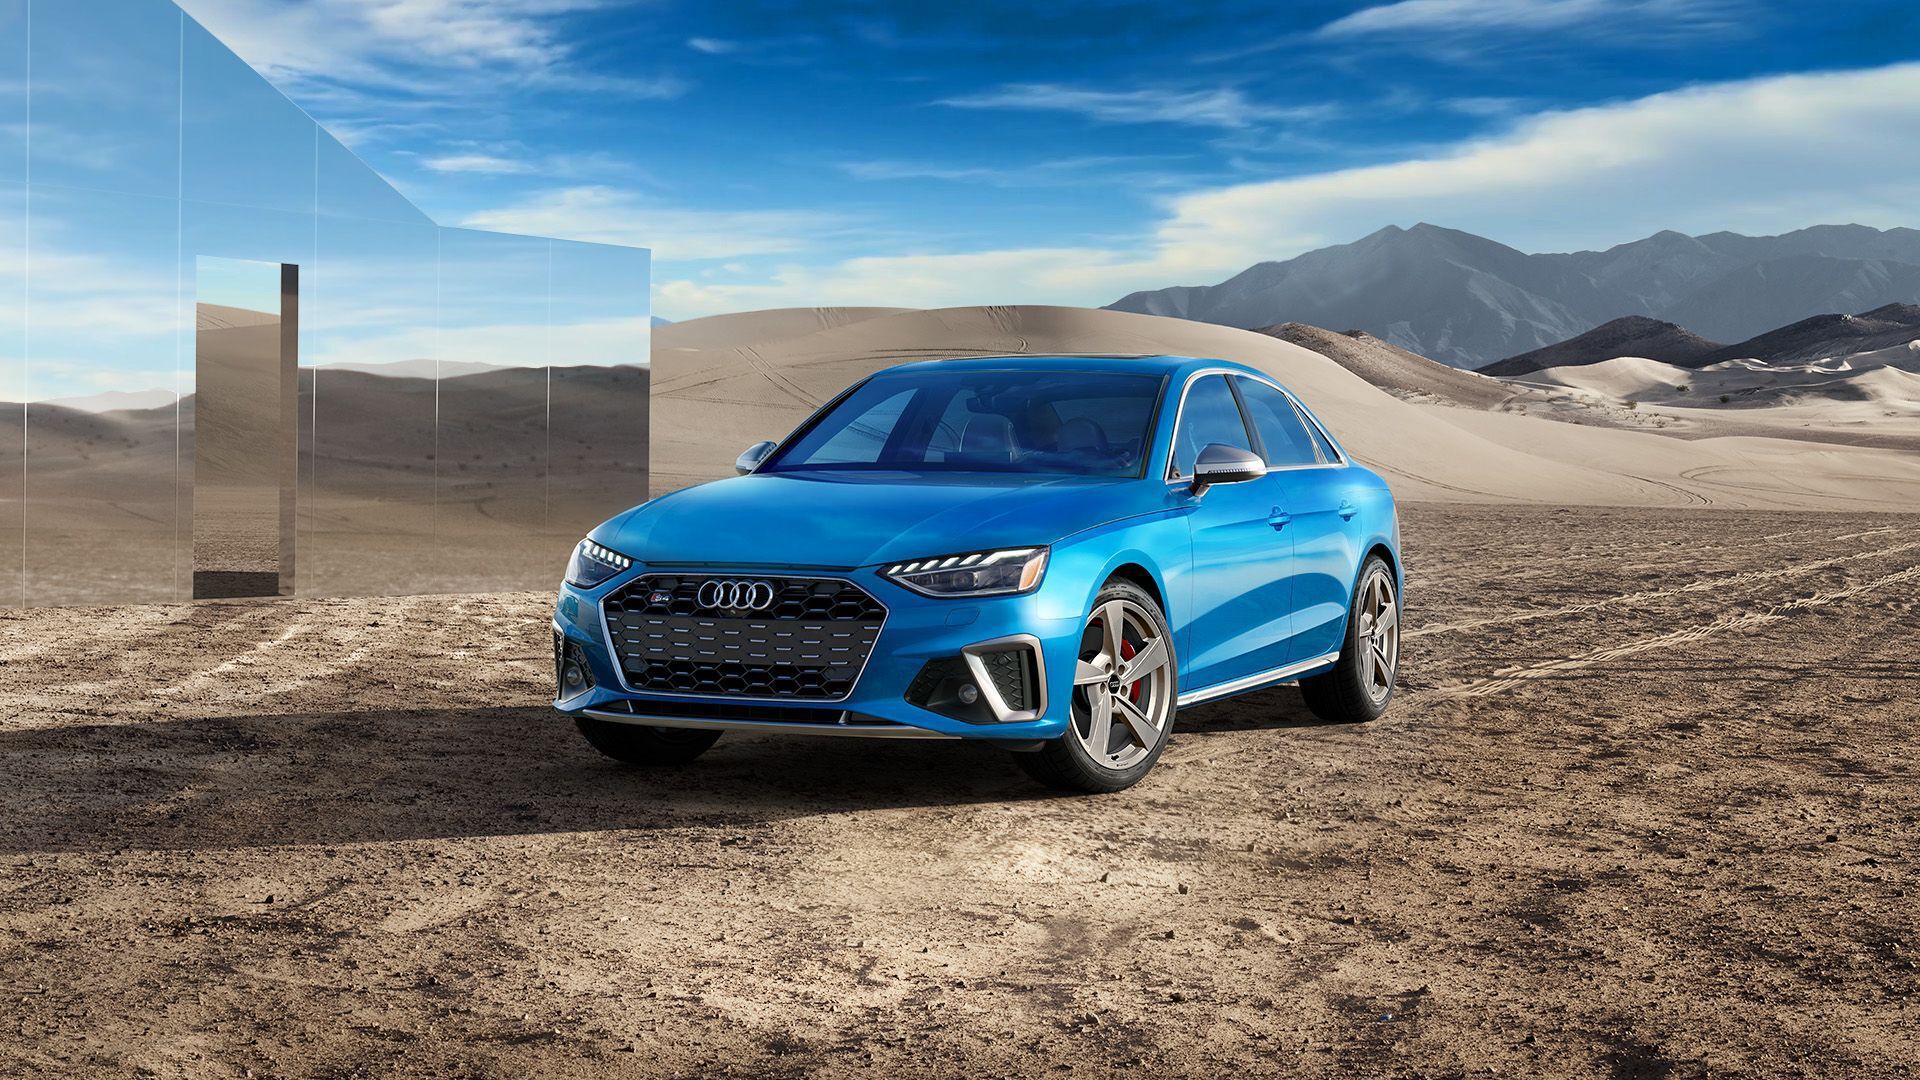
The A6L is a 4-door 5-seater sedan with room for 5 people from automaker Audi.
How Much Does the Audi A6L Cost?
Pricing for the A6L starts at CN¥417,800 Yuan ($58,492 USD) MSRP and goes up to CN¥666,800 Yuan ($93,352 USD) fully equipped.
Audi A6L Engine and Performance
The A6L includes a 2.0TL that delivers 140 Kw (187.74 HP) - 250 Kw (335.26 HP) and 320 Nm (236.80 ft-lb) - 500 Nm (370.00 ft-lb) torque.
Audi A6L Specifications
The A6L has a curb weight of 1,800 kg (4,000 lbs) - 2,000 kg (4,400 lbs).
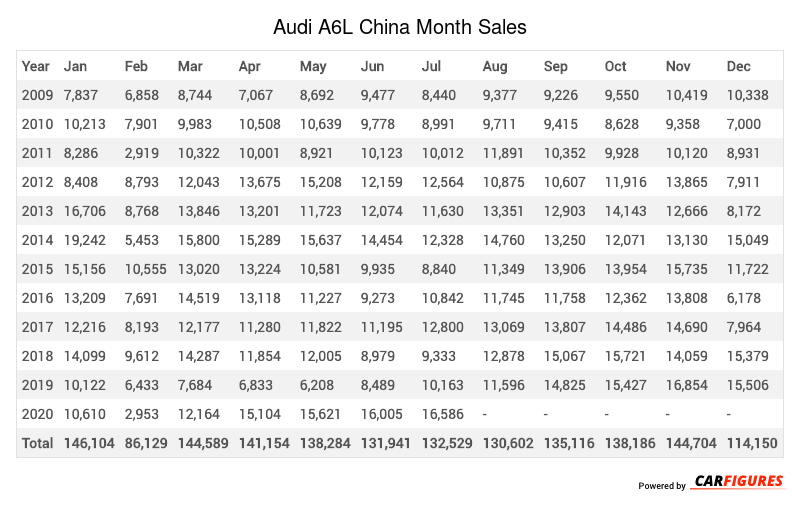
Audi A6L China Sale figures by year, quarter, and month are presented below. Including the most up to date sales data for the Audi A6L.
Year | Jan | Feb | Mar | Apr | May | Jun | Jul | Aug | Sep | Oct | Nov | Dec |
|---|---|---|---|---|---|---|---|---|---|---|---|---|
| 2009 | 7,837 | 6,858 | 8,744 | 7,067 | 8,692 | 9,477 | 8,440 | 9,377 | 9,226 | 9,550 | 10,419 | 10,338 |
| 2010 | 10,213 | 7,901 | 9,983 | 10,508 | 10,639 | 9,778 | 8,991 | 9,711 | 9,415 | 8,628 | 9,358 | 7,000 |
| 2011 | 8,286 | 2,919 | 10,322 | 10,001 | 8,921 | 10,123 | 10,012 | 11,891 | 10,352 | 9,928 | 10,120 | 8,931 |
| 2012 | 8,408 | 8,793 | 12,043 | 13,675 | 15,208 | 12,159 | 12,564 | 10,875 | 10,607 | 11,916 | 13,865 | 7,911 |
| 2013 | 16,706 | 8,768 | 13,846 | 13,201 | 11,723 | 12,074 | 11,630 | 13,351 | 12,903 | 14,143 | 12,666 | 8,172 |
| 2014 | 19,242 | 5,453 | 15,800 | 15,289 | 15,637 | 14,454 | 12,328 | 14,760 | 13,250 | 12,071 | 13,130 | 15,049 |
| 2015 | 15,156 | 10,555 | 13,020 | 13,224 | 10,581 | 9,935 | 8,840 | 11,349 | 13,906 | 13,954 | 15,735 | 11,722 |
| 2016 | 13,209 | 7,691 | 14,519 | 13,118 | 11,227 | 9,273 | 10,842 | 11,745 | 11,758 | 12,362 | 13,808 | 6,178 |
| 2017 | 12,216 | 8,193 | 12,177 | 11,280 | 11,822 | 11,195 | 12,800 | 13,069 | 13,807 | 14,486 | 14,690 | 7,964 |
| 2018 | 14,099 | 9,612 | 14,287 | 11,854 | 12,005 | 8,979 | 9,333 | 12,878 | 15,067 | 15,721 | 14,059 | 15,379 |
| 2019 | 10,122 | 6,433 | 7,684 | 6,833 | 6,208 | 8,489 | 10,163 | 11,596 | 14,825 | 15,427 | 16,854 | 15,506 |
| 2020 | 10,610 | 2,953 | 12,164 | 15,104 | 15,621 | 16,005 | 16,586 | - | - | - | - | - |
| Total | 146,104 | 86,129 | 144,589 | 141,154 | 138,284 | 131,941 | 132,529 | 130,602 | 135,116 | 138,186 | 144,704 | 114,150 |
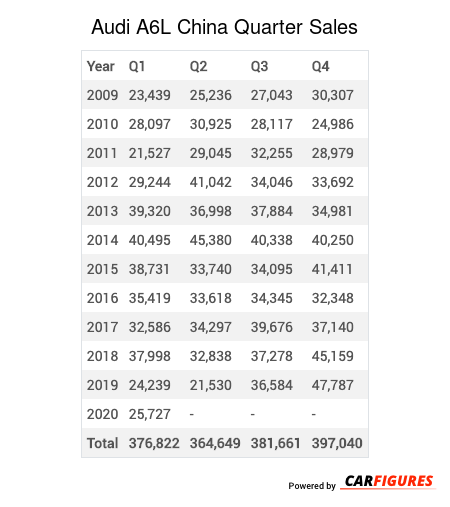
Year | Q1 | Q2 | Q3 | Q4 |
|---|---|---|---|---|
| 2009 | 23,439 | 25,236 | 27,043 | 30,307 |
| 2010 | 28,097 | 30,925 | 28,117 | 24,986 |
| 2011 | 21,527 | 29,045 | 32,255 | 28,979 |
| 2012 | 29,244 | 41,042 | 34,046 | 33,692 |
| 2013 | 39,320 | 36,998 | 37,884 | 34,981 |
| 2014 | 40,495 | 45,380 | 40,338 | 40,250 |
| 2015 | 38,731 | 33,740 | 34,095 | 41,411 |
| 2016 | 35,419 | 33,618 | 34,345 | 32,348 |
| 2017 | 32,586 | 34,297 | 39,676 | 37,140 |
| 2018 | 37,998 | 32,838 | 37,278 | 45,159 |
| 2019 | 24,239 | 21,530 | 36,584 | 47,787 |
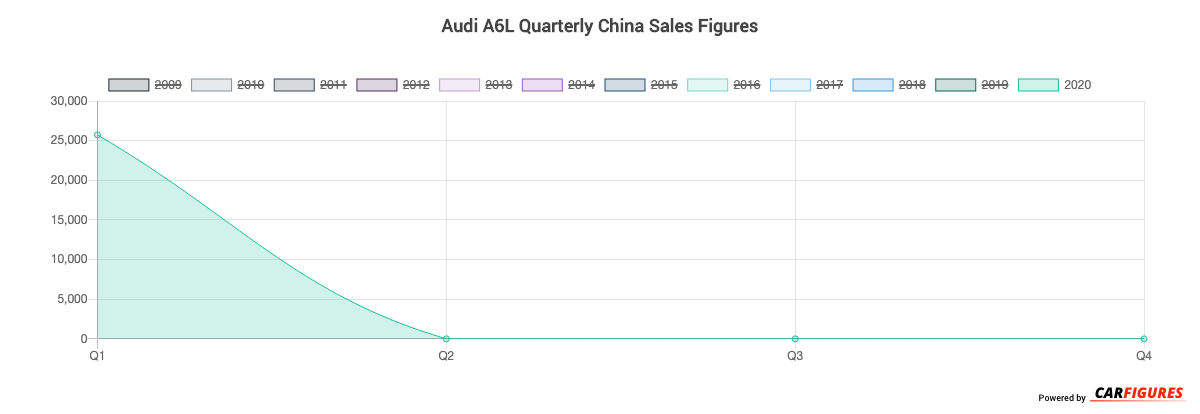
| 2020 | 25,727 | - | - | - |
| Total | 376,822 | 364,649 | 381,661 | 397,040 |
Year | Sales |
|---|---|
| 2020 | 25,727 |
| 2019 | 130,140 |
| 2018 | 153,273 |
| 2017 | 143,699 |
| 2016 | 135,730 |
| 2015 | 147,977 |
| 2014 | 166,463 |
| 2013 | 149,183 |
| 2012 | 138,024 |
| 2011 | 111,806 |
| 2010 | 112,125 |
| 2009 | 106,025 |
| Total | 1,520,172 |
Download Historic Sales Data
Embedded Code
See more widgetsSources: Manufacturers