Last updated: January 10, 2022
General Motors Total Canada Sales Statistics by Year
General Motors Total Canada Sales Statistics by Quarter
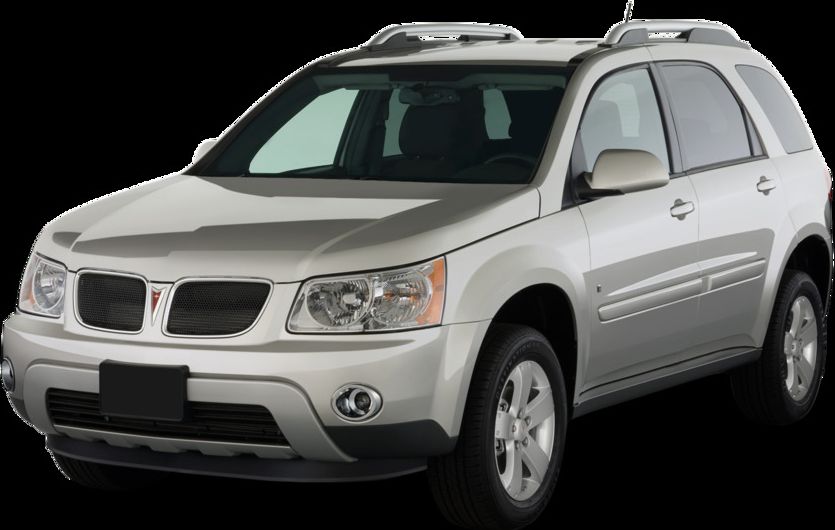
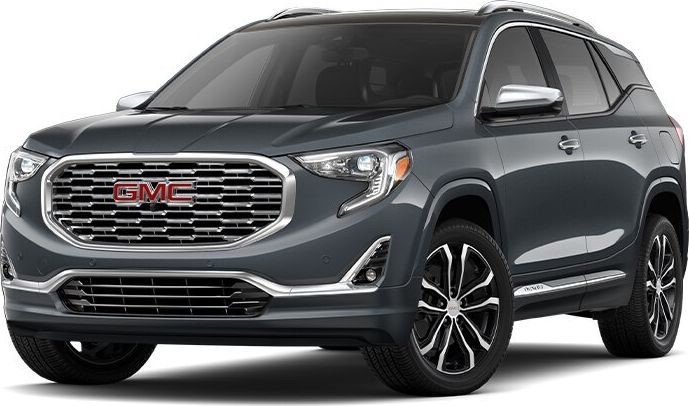
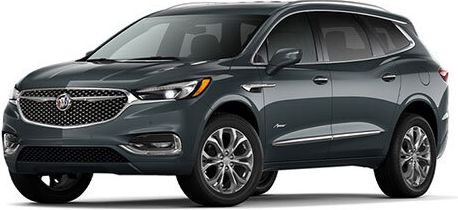
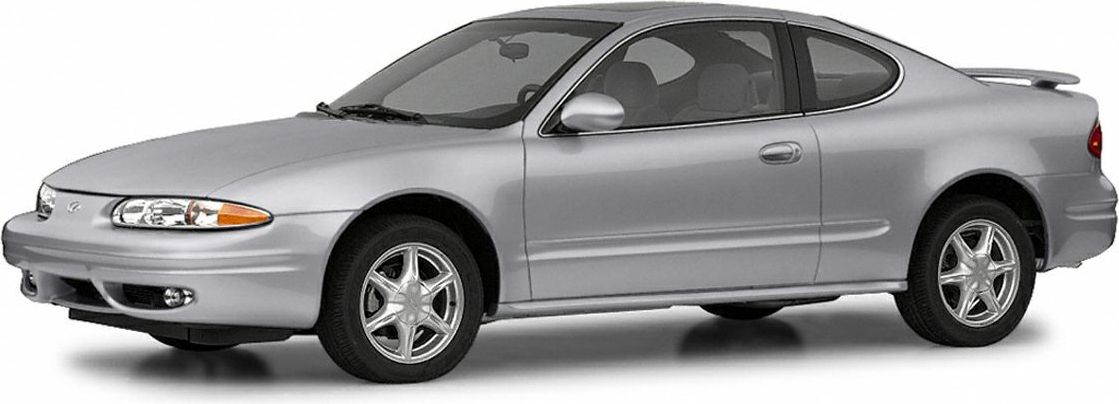
General Motors includes the brands Buick, Cadillac, Chevrolet, GMC, Hummer, Oldsmobile, Pontiac, Saturn
Loading, please wait
Year | Q1 | Q2 | Q3 | Q4 |
|---|---|---|---|---|
| 2005 | 91,186 | 120,196 | 101,331 | 85,825 |
| 2006 | 87,314 | 126,657 | 104,404 | 89,062 |
| 2007 | 80,769 | 130,930 | 102,880 | 83,165 |
| 2008 | 82,666 | 106,408 | 95,854 | 70,127 |
| 2009 | 50,167 | 83,055 | 66,114 | 52,601 |
| 2010 | 48,046 | 75,092 | 65,323 | 58,207 |
| 2011 | 51,348 | 73,503 | 61,787 | 55,775 |
| 2012 | 49,901 | 67,246 | 59,032 | 50,646 |
| 2013 | 47,966 | 73,432 | 58,525 | 55,021 |
| 2014 | 45,762 | 72,886 | 70,639 | 60,513 |
| 2015 | 46,410 | 80,195 | 72,439 | 63,671 |
| 2016 | 54,622 | 75,580 | 69,268 | 67,871 |
| 2017 | 61,248 | 89,248 | 82,070 | 70,260 |
| 2018 | 64,931 | 90,006 | 76,858 | 56,515 |
| 2019 | 55,260 | 75,643 | 74,473 | 53,724 |
| 2020 | 48,032 | 50,074 | 63,260 | 56,966 |
| 2021 | 62,552 | 66,911 | 48,657 | 39,362 |
Loading, please wait
Year | Sales |
|---|---|
| 2021 | 217,482 |
| 2020 | 218,332 |
| 2019 | 259,100 |
| 2018 | 288,310 |
| 2017 | 302,826 |
| 2016 | 267,341 |
| 2015 | 262,715 |
| 2014 | 249,800 |
| 2013 | 234,944 |
| 2012 | 226,825 |
| 2011 | 242,413 |
| 2010 | 246,668 |
| 2009 | 251,937 |
| 2008 | 355,055 |
| 2007 | 397,744 |
| 2006 | 407,437 |
| 2005 | 398,538 |
| Total | 4,827,467 |


