Key Stats
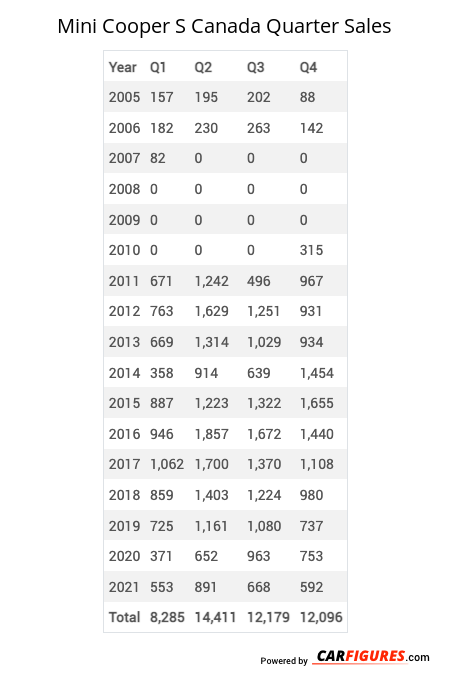
How many Cooper S did Mini sell in Q4 2021?
Mini sold 592 Cooper S in Q4 2021.
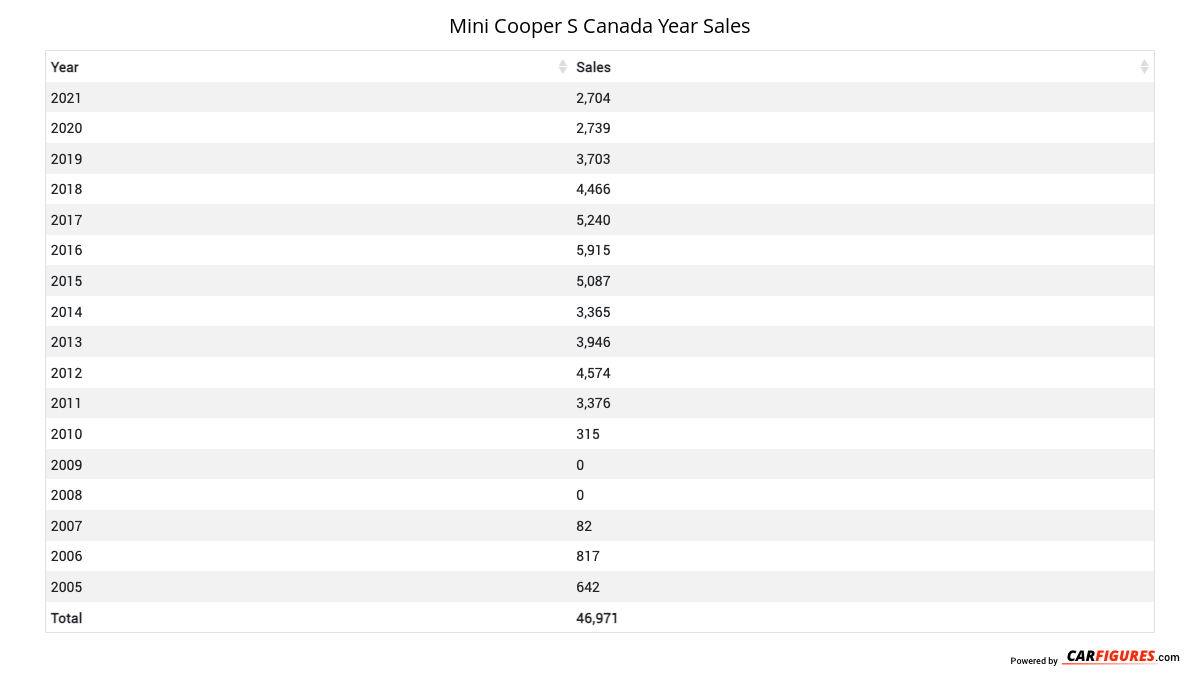
How many Cooper S did Mini sell in 2021?
Mini sold 2,704 Cooper S in 2021. In 2020, Mini sold 2,739 Cooper S. They sold 35 more units in year 2020 compared to 2021 with a percent loss of 1.28% YoY.
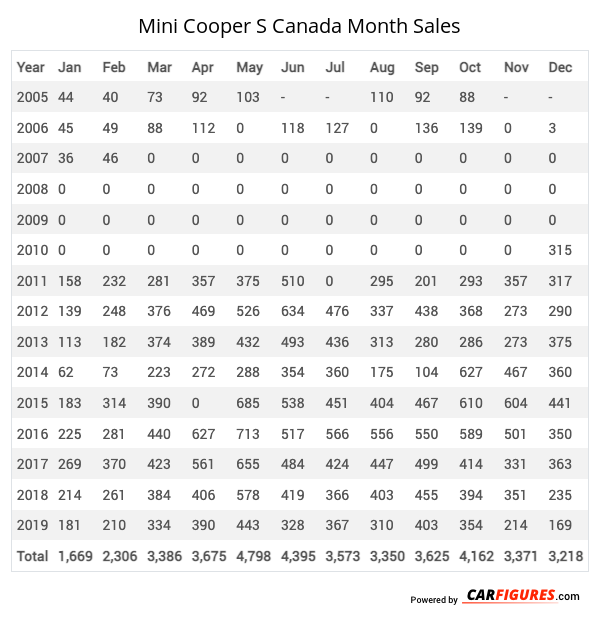
Mini Cooper S Canadian Sale figures by year, quarter, and month are presented below. Including the most up to date sales data for the Mini Cooper S.
Loading, please wait
Year | Jan | Feb | Mar | Apr | May | Jun | Jul | Aug | Sep | Oct | Nov | Dec |
|---|---|---|---|---|---|---|---|---|---|---|---|---|
| 2005 | 44 | 40 | 73 | 92 | 103 | - | - | 110 | 92 | 88 | - | - |
| 2006 | 45 | 49 | 88 | 112 | 0 | 118 | 127 | 0 | 136 | 139 | 0 | 3 |
| 2007 | 36 | 46 | 0 | 0 | 0 | 0 | 0 | 0 | 0 | 0 | 0 | 0 |
| 2008 | 0 | 0 | 0 | 0 | 0 | 0 | 0 | 0 | 0 | 0 | 0 | 0 |
| 2009 | 0 | 0 | 0 | 0 | 0 | 0 | 0 | 0 | 0 | 0 | 0 | 0 |
| 2010 | 0 | 0 | 0 | 0 | 0 | 0 | 0 | 0 | 0 | 0 | 0 | 315 |
| 2011 | 158 | 232 | 281 | 357 | 375 | 510 | 0 | 295 | 201 | 293 | 357 | 317 |
| 2012 | 139 | 248 | 376 | 469 | 526 | 634 | 476 | 337 | 438 | 368 | 273 | 290 |
| 2013 | 113 | 182 | 374 | 389 | 432 | 493 | 436 | 313 | 280 | 286 | 273 | 375 |
| 2014 | 62 | 73 | 223 | 272 | 288 | 354 | 360 | 175 | 104 | 627 | 467 | 360 |
| 2015 | 183 | 314 | 390 | 0 | 685 | 538 | 451 | 404 | 467 | 610 | 604 | 441 |
| 2016 | 225 | 281 | 440 | 627 | 713 | 517 | 566 | 556 | 550 | 589 | 501 | 350 |
| 2017 | 269 | 370 | 423 | 561 | 655 | 484 | 424 | 447 | 499 | 414 | 331 | 363 |
| 2018 | 214 | 261 | 384 | 406 | 578 | 419 | 366 | 403 | 455 | 394 | 351 | 235 |
| 2019 | 181 | 210 | 334 | 390 | 443 | 328 | 367 | 310 | 403 | 354 | 214 | 169 |
| Total | 1,669 | 2,306 | 3,386 | 3,675 | 4,798 | 4,395 | 3,573 | 3,350 | 3,625 | 4,162 | 3,371 | 3,218 |
Loading, please wait
Year | Q1 | Q2 | Q3 | Q4 |
|---|---|---|---|---|
| 2005 | 157 | 195 | 202 | 88 |
| 2006 | 182 | 230 | 263 | 142 |
| 2007 | 82 | 0 | 0 | 0 |
| 2008 | 0 | 0 | 0 | 0 |
| 2009 | 0 | 0 | 0 | 0 |
| 2010 | 0 | 0 | 0 | 315 |
| 2011 | 671 | 1,242 | 496 | 967 |
| 2012 | 763 | 1,629 | 1,251 | 931 |
| 2013 | 669 | 1,314 | 1,029 | 934 |
| 2014 | 358 | 914 | 639 | 1,454 |
| 2015 | 887 | 1,223 | 1,322 | 1,655 |
| 2016 | 946 | 1,857 | 1,672 | 1,440 |
| 2017 | 1,062 | 1,700 | 1,370 | 1,108 |
| 2018 | 859 | 1,403 | 1,224 | 980 |
| 2019 | 725 | 1,161 | 1,080 | 737 |
| 2020 | 371 | 652 | 963 | 753 |
| 2021 | 553 | 891 | 668 | 592 |
| Total | 8,285 | 14,411 | 12,179 | 12,096 |
Loading, please wait
Year | Sales |
|---|---|
| 2021 | 2,704 |
| 2020 | 2,739 |
| 2019 | 3,703 |
| 2018 | 4,466 |
| 2017 | 5,240 |
| 2016 | 5,915 |
| 2015 | 5,087 |
| 2014 | 3,365 |
| 2013 | 3,946 |
| 2012 | 4,574 |
| 2011 | 3,376 |
| 2010 | 315 |
| 2009 | 0 |
| 2008 | 0 |
| 2007 | 82 |
| 2006 | 817 |
| 2005 | 642 |
| Total | 46,971 |
Download Historic Sales Data
Embedded Code
See more widgetsSources: Manufacturers