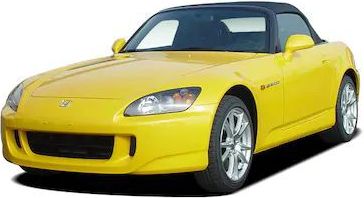
Lincoln MKT US Chart and Table Sales Widget
Bloggers and website editors, please find below our car sales data widgets. To install a widget, all you have to do is copy and paste the HTML code of the desired widget and insert it on your site.
Embedded Code
Embedded Code
Embedded Code
Loading, please wait
Year | Jan | Feb | Mar | Apr | May | Jun | Jul | Aug | Sep | Oct | Nov | Dec |
|---|---|---|---|---|---|---|---|---|---|---|---|---|
| 2009 | - | - | - | - | - | - | - | - | 455 | 619 | 648 | 858 |
| 2010 | 715 | 647 | 744 | 625 | 709 | 520 | 606 | 609 | 526 | 506 | 590 | 638 |
| 2011 | 390 | 412 | 455 | 456 | 399 | 395 | 469 | 408 | 373 | 369 | 324 | 574 |
| 2012 | 279 | 842 | 785 | 654 | 812 | 697 | 738 | 604 | 488 | 426 | 537 | 653 |
| 2013 | 411 | 511 | 571 | 453 | 621 | 689 | 437 | 551 | 414 | 327 | 431 | 598 |
| 2014 | 362 | 365 | 556 | 452 | 503 | 509 | 406 | 313 | 259 | 338 | 381 | 356 |
| 2015 | 268 | 216 | 373 | 428 | 442 | 376 | 591 | 285 | 430 | 456 | 425 | 406 |
| 2016 | 505 | 2,128 | 390 | 472 | 298 | 259 | 259 | 273 | 254 | 248 | 187 | 649 |
| 2017 | 260 | 287 | 221 | 240 | 382 | 287 | 226 | 227 | 280 | 248 | 161 | 186 |
| 2018 | 123 | 137 | 252 | 271 | 246 | 213 | 211 | 200 | 131 | 160 | 109 | 271 |
| Total | 3,313 | 5,545 | 4,347 | 4,051 | 4,412 | 3,945 | 3,943 | 3,470 | 3,610 | 3,697 | 3,793 | 5,189 |
Powered by CarFigures.com
Embedded Code
Loading, please wait
Year | Q1 | Q2 | Q3 | Q4 |
|---|---|---|---|---|
| 2009 | - | - | 455 | 2,125 |
| 2010 | 2,106 | 1,854 | 1,741 | 1,734 |
| 2011 | 1,257 | 1,250 | 1,250 | 1,267 |
| 2012 | 1,906 | 2,163 | 1,830 | 1,616 |
| 2013 | 1,493 | 1,763 | 1,402 | 1,356 |
| 2014 | 1,283 | 1,464 | 978 | 1,075 |
| 2015 | 857 | 1,246 | 1,306 | 1,287 |
| 2016 | 3,023 | 1,029 | 786 | 1,084 |
| 2017 | 768 | 909 | 733 | 595 |
| 2018 | 512 | 730 | 542 | 540 |
| 2019 | 1,242 | 1,246 | 625 | 275 |
| 2020 | 109 | 20 | 23 | 177 |
| Total | 14,556 | 13,674 | 11,671 | 13,131 |
Powered by CarFigures.com
Embedded Code
Loading, please wait
Year | Sales |
|---|---|
| 2020 | 329 |
| 2019 | 3,388 |
| 2018 | 2,324 |
| 2017 | 3,005 |
| 2016 | 5,922 |
| 2015 | 4,696 |
| 2014 | 4,800 |
| 2013 | 6,014 |
| 2012 | 7,515 |
| 2011 | 5,024 |
| 2010 | 7,435 |
| 2009 | 2,580 |
| Total | 53,032 |
Powered by CarFigures.com
Embedded Code
Need help with customization or help to embedded widget into your website? Contact Us.


