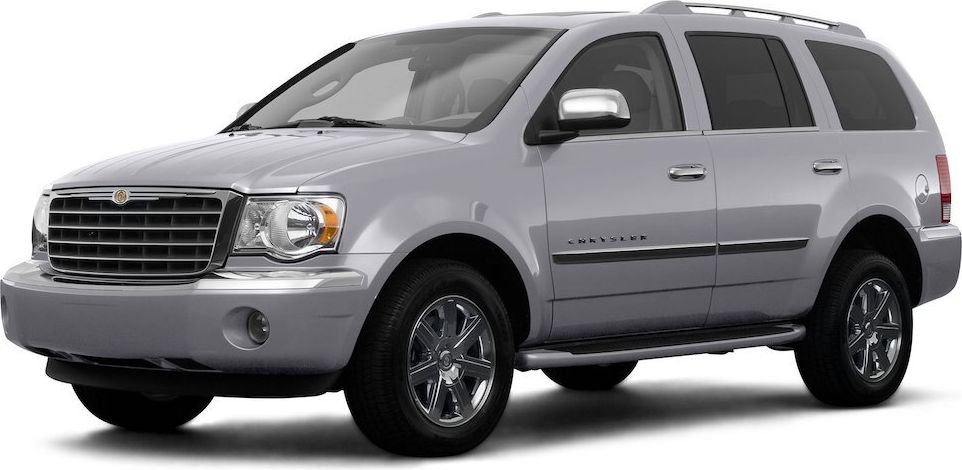
Changan Escape China Chart and Table Sales Widget
Bloggers and website editors, please find below our car sales data widgets. To install a widget, all you have to do is copy and paste the HTML code of the desired widget and insert it on your site.
Embedded Code
Embedded Code
Embedded Code
| Year | Jan | Feb | Mar | Apr | May | Jun | Jul | Aug | Sep | Oct | Nov | Dec |
|---|---|---|---|---|---|---|---|---|---|---|---|---|
| 2012 | 129 | 204 | 1000 | 2003 | 2322 | 3650 | 5169 | 1729 | 5825 | 5975 | 7120 | 5113 |
| 2013 | 8861 | 6212 | 5732 | 7413 | 7159 | 5873 | 6079 | 6361 | 8973 | 7806 | 9855 | 10399 |
| 2014 | 13754 | 8956 | 13255 | 12617 | 12991 | 12980 | 13036 | 13372 | 16324 | 15758 | 11581 | 10261 |
| 2015 | 22964 | 15051 | 18458 | 13758 | 16106 | 14277 | 10214 | 11698 | 14372 | 15454 | 15798 | 14182 |
| 2016 | 18265 | 12987 | 16454 | 13448 | 10590 | 9954 | 8295 | 11824 | 16874 | 17009 | 10571 | 10101 |
| 2017 | 13607 | 10050 | 11727 | 4915 | 5519 | 8379 | 4981 | 4153 | 8470 | 5764 | 6731 | 8208 |
| 2018 | 5070 | 7448 | 21606 | 4095 | 2845 | 3777 | 3670 | 3790 | 8510 | 8017 | 4139 | 2029 |
| 2019 | 3481 | 4908 | 5434 | 4403 | 4708 | 4938 | 8264 | 7484 | 6876 | 4923 | 5724 | 6368 |
| 2020 | 4593 | 2015 | 8402 | 11092 | 10941 | 16702 | 18189 | - | - | - | - | - |
| Total | 90724 | 67831 | 102068 | 73744 | 73181 | 80530 | 77897 | 60411 | 86224 | 80706 | 71519 | 66661 |
Powered by CarFigures.com
Embedded Code
| Year | Q1 | Q2 | Q3 | Q4 |
|---|---|---|---|---|
| 2012 | 1333 | 7975 | 12723 | 18208 |
| 2013 | 20805 | 20445 | 21413 | 28060 |
| 2014 | 35965 | 38588 | 42732 | 37600 |
| 2015 | 56473 | 44141 | 36284 | 45434 |
| 2016 | 47706 | 33992 | 36993 | 37681 |
| 2017 | 35384 | 18813 | 17604 | 20703 |
| 2018 | 34124 | 10717 | 15970 | 14185 |
| 2019 | 13823 | 14049 | 22624 | 17015 |
| 2020 | 15010 | - | - | - |
| Total | 260623 | 188720 | 206343 | 218886 |
Powered by CarFigures.com
Embedded Code
| Year | Sales |
|---|---|
| 2020 | 15010 |
| 2019 | 67511 |
| 2018 | 74996 |
| 2017 | 92504 |
| 2016 | 156372 |
| 2015 | 182332 |
| 2014 | 154885 |
| 2013 | 90723 |
| 2012 | 40239 |
| Total | 874572 |
Powered by CarFigures.com
Embedded Code
Need help with customization or help to embedded widget into your website? Contact Us.


