Key Stats
How many Compass did Jeep sell in 2023?
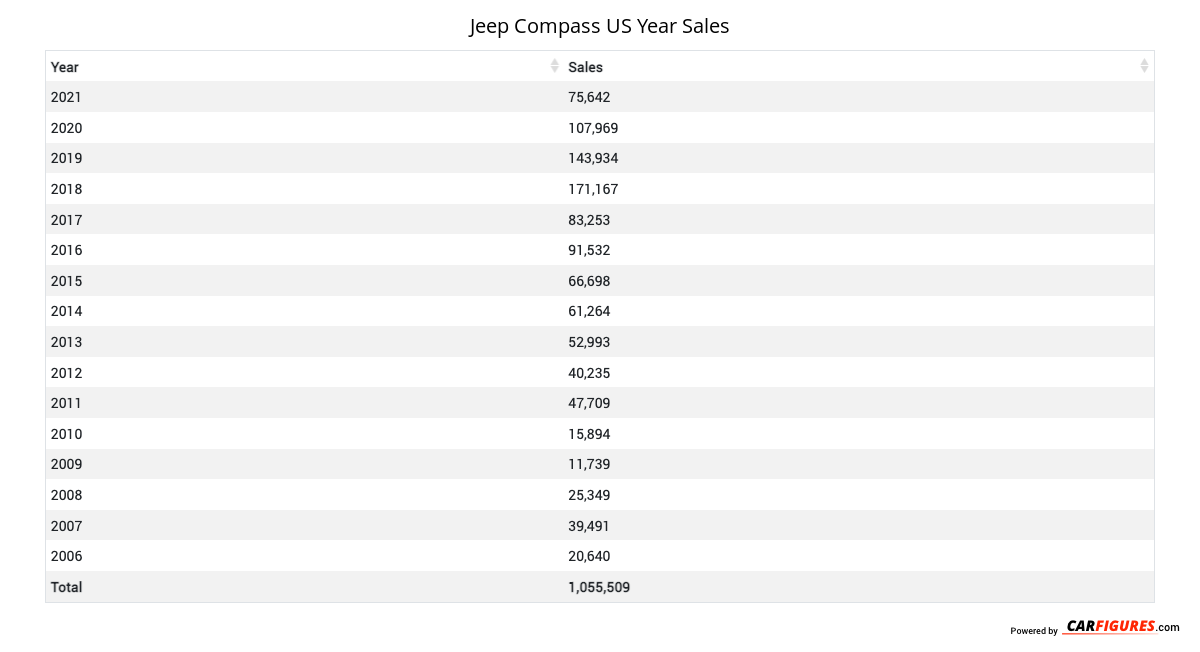
Jeep sold 51,293 Compass in 2023. In 2022, Jeep sold 86,175 Compass. They sold 34,882 more units in year 2022 compared to 2023 with a percent loss of 40.48% YoY.
Overview
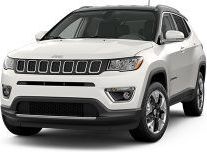
The 2022 Jeep Compass is a vehicle from automaker Jeep.
How Much Does the 2022 Jeep Compass Cost?
The 2022 Jeep Compass starts at $26,020 MSRP. Fully loaded, the Jeep Compass will cost you about $32,420.
Jeep Compass Engine, Transmission, and Performance Numbers
Jeep Compass is powered by a 2.4-liter engine with a Front Wheel Drive powertrain that makes 177 -hp and 172 lb-ft torque. The transmission on the Jeep Compass is an 6-Speed Aisin F21-250 Gen 3 Auto (STD).
List of Jeep Compass Competitors
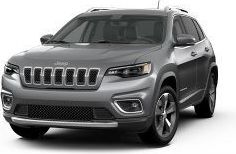
Some of Jeep Compass competitors include the Jeep Cherokee, Jeep Renegade and Ford Escape.
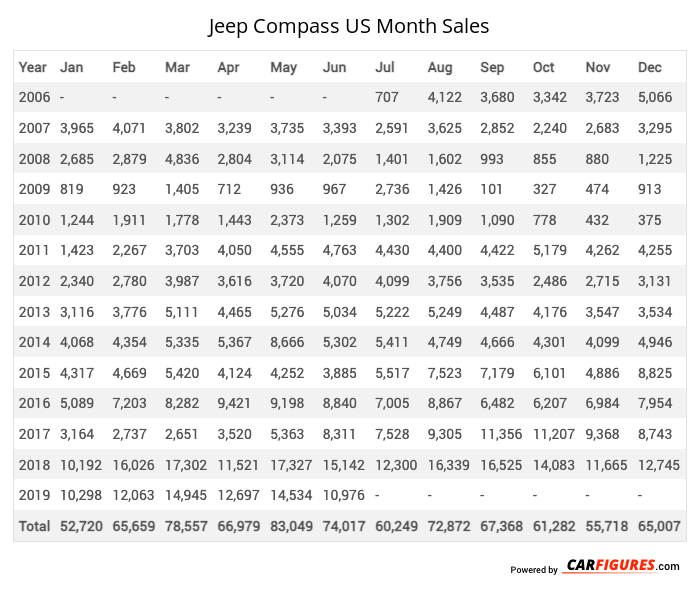
Jeep Compass United States Sale figures by year, quarter, and month are presented below. Including the most up to date sales data for the Jeep Compass. See how the Jeep Compass stacks up the other models in the Compact Crossover/SUVs, Crossover/SUVS segments.
| Year | Jan | Feb | Mar | Apr | May | Jun | Jul | Aug | Sep | Oct | Nov | Dec |
|---|---|---|---|---|---|---|---|---|---|---|---|---|
| 2006 | - | - | - | - | - | - | 707 | 4122 | 3680 | 3342 | 3723 | 5066 |
| 2007 | 3965 | 4071 | 3802 | 3239 | 3735 | 3393 | 2591 | 3625 | 2852 | 2240 | 2683 | 3295 |
| 2008 | 2685 | 2879 | 4836 | 2804 | 3114 | 2075 | 1401 | 1602 | 993 | 855 | 880 | 1225 |
| 2009 | 819 | 923 | 1405 | 712 | 936 | 967 | 2736 | 1426 | 101 | 327 | 474 | 913 |
| 2010 | 1244 | 1911 | 1778 | 1443 | 2373 | 1259 | 1302 | 1909 | 1090 | 778 | 432 | 375 |
| 2011 | 1423 | 2267 | 3703 | 4050 | 4555 | 4763 | 4430 | 4400 | 4422 | 5179 | 4262 | 4255 |
| 2012 | 2340 | 2780 | 3987 | 3616 | 3720 | 4070 | 4099 | 3756 | 3535 | 2486 | 2715 | 3131 |
| 2013 | 3116 | 3776 | 5111 | 4465 | 5276 | 5034 | 5222 | 5249 | 4487 | 4176 | 3547 | 3534 |
| 2014 | 4068 | 4354 | 5335 | 5367 | 8666 | 5302 | 5411 | 4749 | 4666 | 4301 | 4099 | 4946 |
| 2015 | 4317 | 4669 | 5420 | 4124 | 4252 | 3885 | 5517 | 7523 | 7179 | 6101 | 4886 | 8825 |
| 2016 | 5089 | 7203 | 8282 | 9421 | 9198 | 8840 | 7005 | 8867 | 6482 | 6207 | 6984 | 7954 |
| 2017 | 3164 | 2737 | 2651 | 3520 | 5363 | 8311 | 7528 | 9305 | 11356 | 11207 | 9368 | 8743 |
| 2018 | 10192 | 16026 | 17302 | 11521 | 17327 | 15142 | 12300 | 16339 | 16525 | 14083 | 11665 | 12745 |
| 2019 | 10298 | 12063 | 14945 | 12697 | 14534 | 10976 | - | - | - | - | - | - |
| Total | 52720 | 65659 | 78557 | 66979 | 83049 | 74017 | 60249 | 72872 | 67368 | 61282 | 55718 | 65007 |
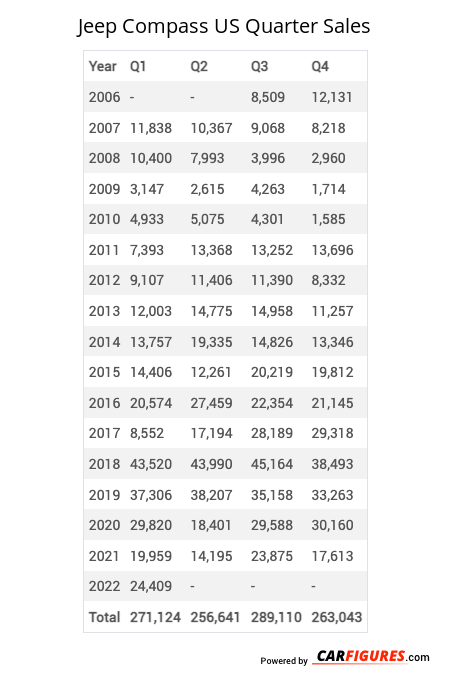
| Year | Q1 | Q2 | Q3 | Q4 |
|---|---|---|---|---|
| 2006 | - | - | 8509 | 12131 |
| 2007 | 11838 | 10367 | 9068 | 8218 |
| 2008 | 10400 | 7993 | 3996 | 2960 |
| 2009 | 3147 | 2615 | 4263 | 1714 |
| 2010 | 4933 | 5075 | 4301 | 1585 |
| 2011 | 7393 | 13368 | 13252 | 13696 |
| 2012 | 9107 | 11406 | 11390 | 8332 |
| 2013 | 12003 | 14775 | 14958 | 11257 |
| 2014 | 13757 | 19335 | 14826 | 13346 |
| 2015 | 14406 | 12261 | 20219 | 19812 |
| 2016 | 20574 | 27459 | 22354 | 21145 |
| 2017 | 8552 | 17194 | 28189 | 29318 |
| 2018 | 43520 | 43990 | 45164 | 38493 |
| 2019 | 37306 | 38207 | 35158 | 33263 |
| 2020 | 29820 | 18401 | 29588 | 30160 |
| 2021 | 19959 | 14195 | 23875 | 17613 |
| 2022 | 24409 | 21926 | 20631 | 19209 |
| 2023 | 23209 | 28084 | 0 | 0 |
| 2024 | - | - | - | - |
| Total | 294333 | 306651 | 309741 | 282252 |
| Year | Sales |
|---|---|
| 2023 | 51293 |
| 2022 | 86175 |
| 2021 | 75642 |
| 2020 | 107969 |
| 2019 | 143934 |
| 2018 | 171167 |
| 2017 | 83253 |
| 2016 | 91532 |
| 2015 | 66698 |
| 2014 | 61264 |
| 2013 | 52993 |
| 2012 | 40235 |
| 2011 | 47709 |
| 2010 | 15894 |
| 2009 | 11739 |
| 2008 | 25349 |
| 2007 | 39491 |
| 2006 | 20640 |
| Total | 1192977 |
Download Historic Sales Data
Embedded Code
See more widgetsSources: Manufacturers