Last updated: January 31, 2020
Bentley Total US Sales Statistics by Year
Bentley Total US Sales Statistics by Quarter
Current Lineup

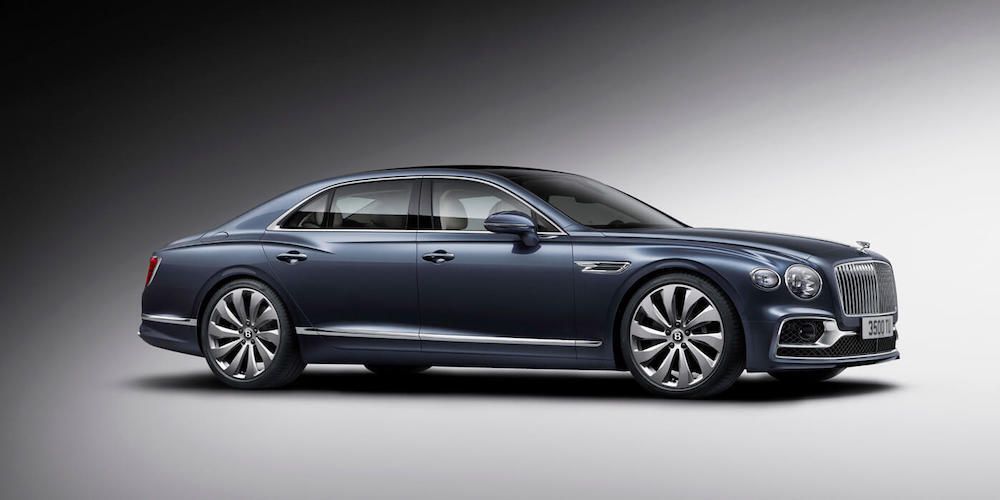
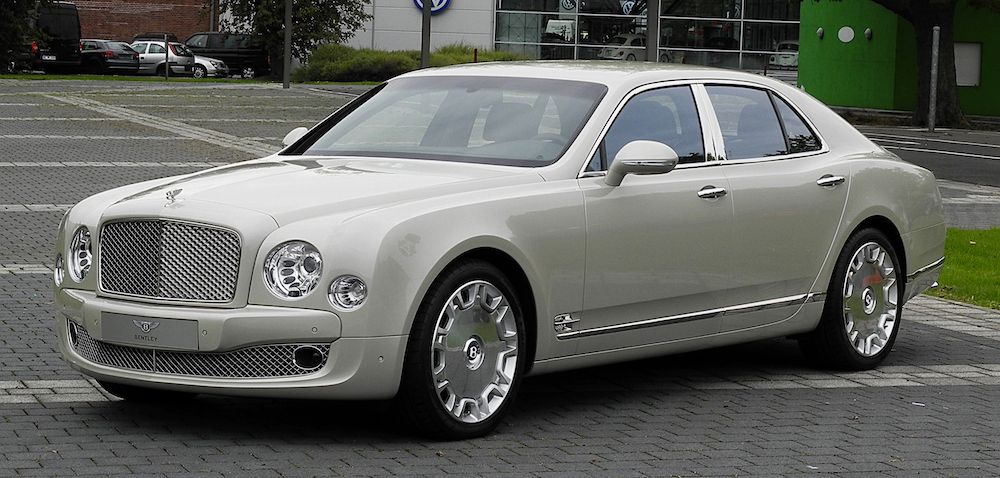
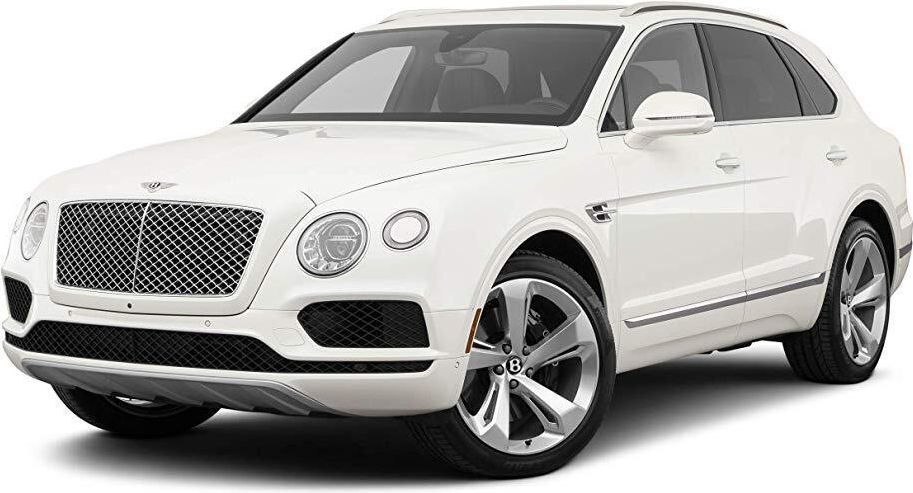
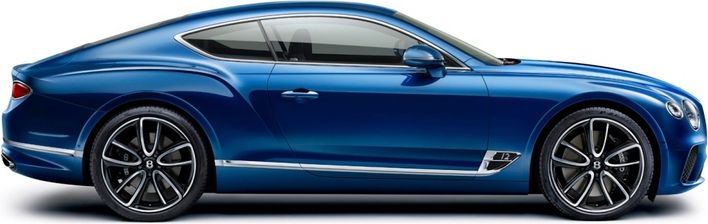
Bentley includes the cars 2024 Bentayga, 2024 Continental, 2024 Flying Spur, 2024 Mulsanne
Loading, please wait
Year | Q1 | Q2 | Q3 | Q4 |
|---|---|---|---|---|
| 2015 | - | - | 111 | 890 |
| 2016 | 262 | 366 | 847 | 1,106 |
| 2017 | 552 | 596 | 524 | 733 |
| 2018 | 256 | - | - | - |
Loading, please wait
Year | Sales |
|---|---|
| 2018 | 256 |
| 2017 | 2,405 |
| 2016 | 2,581 |
| 2015 | 1,001 |
| Total | 6,243 |