Last updated: April 02, 2020
us-auto-market-2020-q1-best-sellers-promo-hhcRMnlM

Key Stats

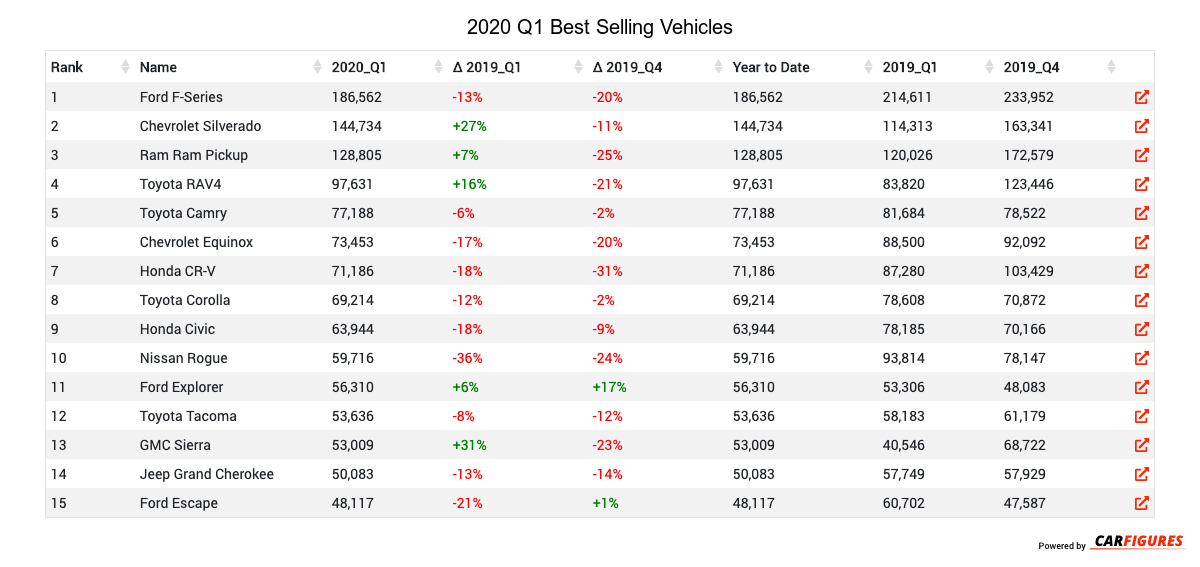
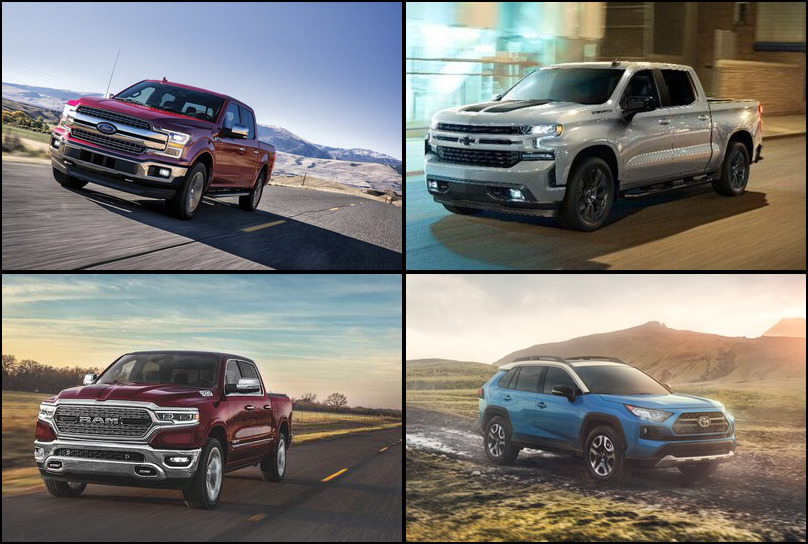
What is the best selling vehicle in 2020 Q1?

The best selling vehicle in 2020 Q1 is the Ford F-Series with 186,562 units in sales volume this quarter.

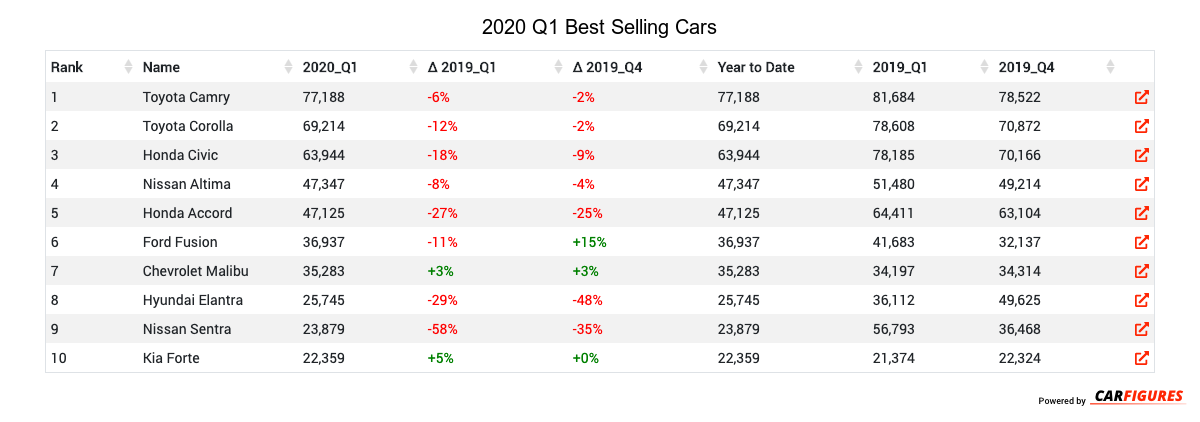
What is the best selling car in 2020 Q1?

The best selling car in 2020 Q1 is the Toyota Camry with 77,188 units in sales volume this quarter.

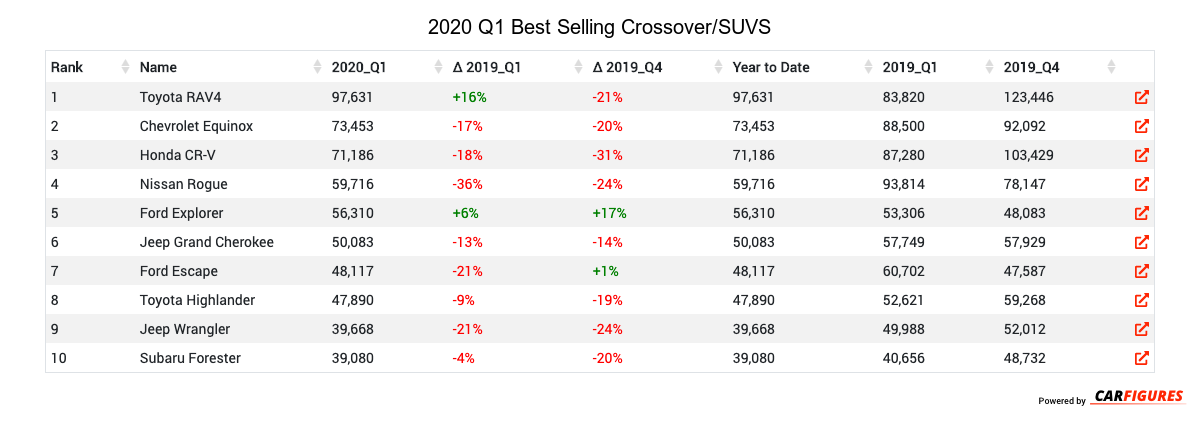
What is the best selling crossover/SUV in 2020 Q1?

The best selling crossover/SUV in 2020 Q1 is the Toyota RAV4 with 97,631 units in sales volume this quarter.

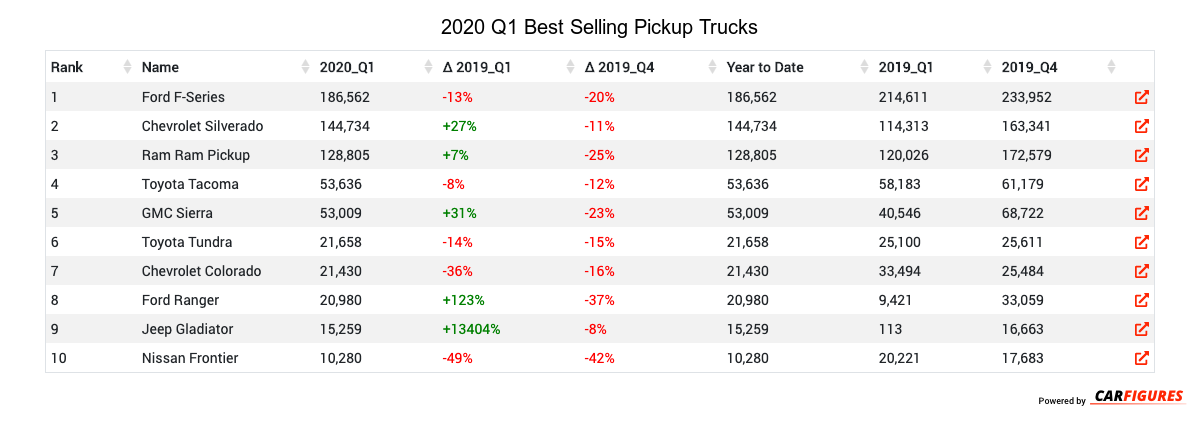
What is the best selling pickup truck in 2020 Q1?

The best selling pickup truck in 2020 Q1 is the Ford F-Series with 186,562 units in sales volume this quarter.


Rank Name 2020_Q1 Δ 2019_Q1 Δ 2019_Q4 Year to Date 2019_Q1 2019_Q4
1 Ford F-Series 186562 -13 -20 186562 214611 233952
2 Chevrolet Silverado 144734 27 -11 144734 114313 163341
3 Ram Ram Pickup 128805 7 -25 128805 120026 172579
4 Toyota RAV4 97631 16 -21 97631 83820 123446
5 Toyota Camry 77188 -6 -2 77188 81684 78522
6 Chevrolet Equinox 73453 -17 -20 73453 88500 92092
7 Honda CR-V 71186 -18 -31 71186 87280 103429
8 Toyota Corolla 69214 -12 -2 69214 78608 70872
9 Honda Civic 63944 -18 -9 63944 78185 70166
10 Nissan Rogue 59716 -36 -24 59716 93814 78147
11 Ford Explorer 56310 6 17 56310 53306 48083
12 Toyota Tacoma 53636 -8 -12 53636 58183 61179
13 GMC Sierra 53009 31 -23 53009 40546 68722
14 Jeep Grand Cherokee 50083 -13 -14 50083 57749 57929
15 Ford Escape 48117 -21 1 48117 60702 47587
Rank Name 2020_Q1 Δ 2019_Q1 Δ 2019_Q4 Year to Date 2019_Q1 2019_Q4
1 Toyota Camry 77188 -6 -2 77188 81684 78522
2 Toyota Corolla 69214 -12 -2 69214 78608 70872
3 Honda Civic 63944 -18 -9 63944 78185 70166
4 Nissan Altima 47347 -8 -4 47347 51480 49214
5 Honda Accord 47125 -27 -25 47125 64411 63104
6 Ford Fusion 36937 -11 15 36937 41683 32137
7 Chevrolet Malibu 35283 3 3 35283 34197 34314
8 Hyundai Elantra 25745 -29 -48 25745 36112 49625
9 Nissan Sentra 23879 -58 -35 23879 56793 36468
10 Kia Forte 22359 5 0 22359 21374 22324
Rank Name 2020_Q1 Δ 2019_Q1 Δ 2019_Q4 Year to Date 2019_Q1 2019_Q4
1 Toyota RAV4 97631 16 -21 97631 83820 123446
2 Chevrolet Equinox 73453 -17 -20 73453 88500 92092
3 Honda CR-V 71186 -18 -31 71186 87280 103429
4 Nissan Rogue 59716 -36 -24 59716 93814 78147
5 Ford Explorer 56310 6 17 56310 53306 48083
6 Jeep Grand Cherokee 50083 -13 -14 50083 57749 57929
7 Ford Escape 48117 -21 1 48117 60702 47587
8 Toyota Highlander 47890 -9 -19 47890 52621 59268
9 Jeep Wrangler 39668 -21 -24 39668 49988 52012
10 Subaru Forester 39080 -4 -20 39080 40656 48732
Rank Name 2020_Q1 Δ 2019_Q1 Δ 2019_Q4 Year to Date 2019_Q1 2019_Q4
1 Ford F-Series 186562 -13 -20 186562 214611 233952
2 Chevrolet Silverado 144734 27 -11 144734 114313 163341
3 Ram Ram Pickup 128805 7 -25 128805 120026 172579
4 Toyota Tacoma 53636 -8 -12 53636 58183 61179
5 GMC Sierra 53009 31 -23 53009 40546 68722
6 Toyota Tundra 21658 -14 -15 21658 25100 25611
7 Chevrolet Colorado 21430 -36 -16 21430 33494 25484
8 Ford Ranger 20980 123 -37 20980 9421 33059
9 Jeep Gladiator 15259 13404 -8 15259 113 16663
10 Nissan Frontier 10280 -49 -42 10280 20221 17683

Download Historic Sales Data
Looking for more data/visualizations? Send us an email at [email protected] for customized data aggregates and visualizations.