Last updated: January 31, 2020

Total Sales


Key Stats

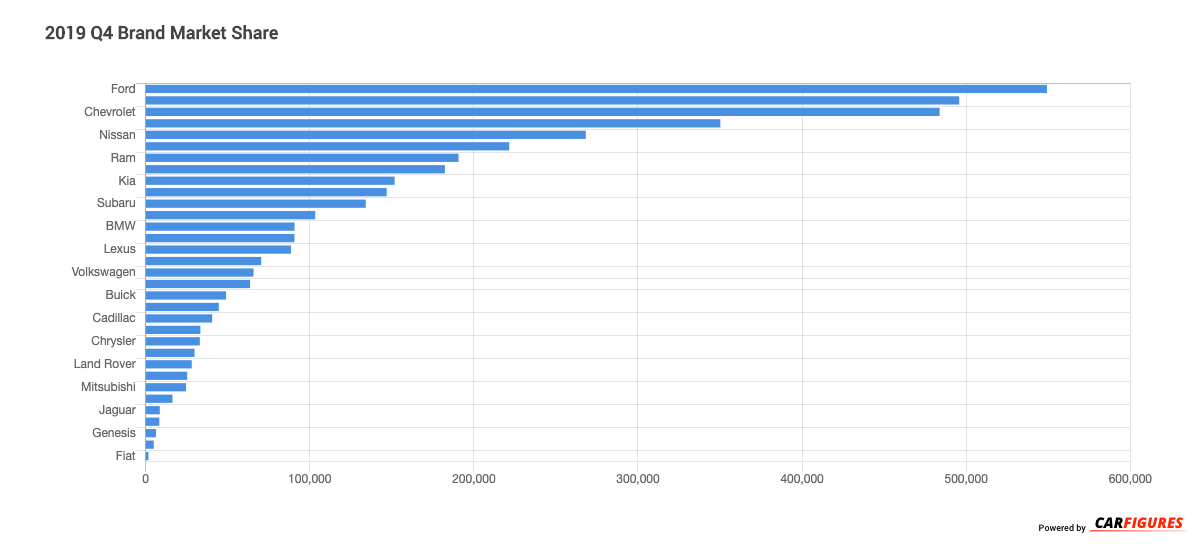
What automotive brand sold the most vehicles in 2019 Q4?

The brand that sold the most vehicles in 2019 Q4 is Ford with 549,205 units in sales volume this quarter.

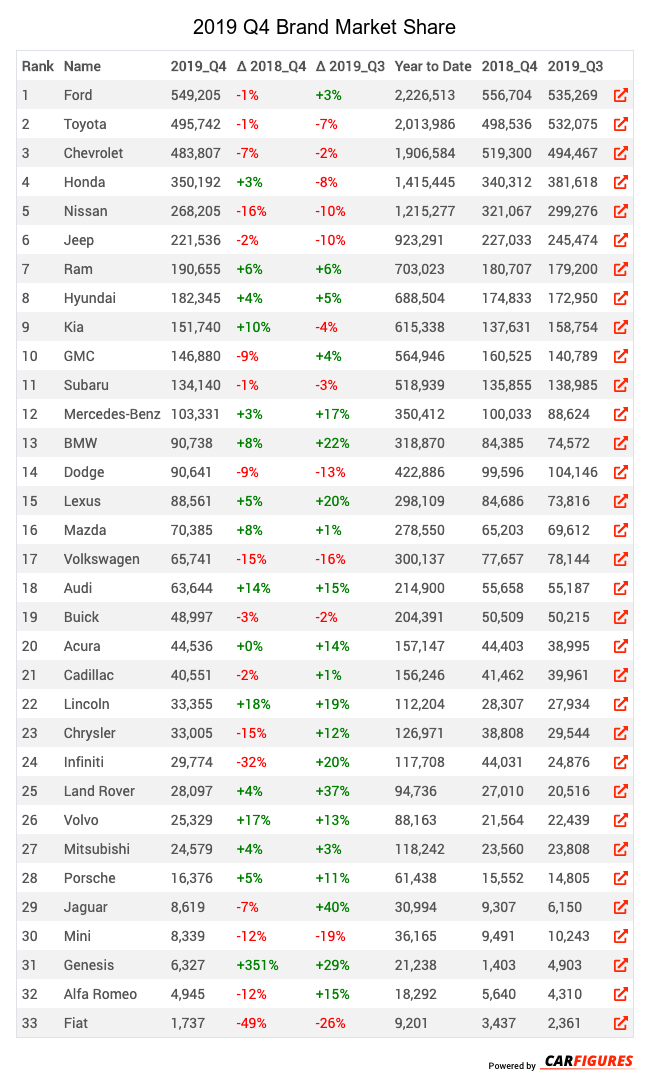
What automotive brand had the biggest growth from 2019 Q3 to 2019 Q4?

The automotive brand that had the biggest growth from 2018 Q3 to 2019 Q4 is Jaguar with a gain of 40%.

What automotive brand had the biggest decline from 2019 Q3 to 2019 Q4?

The automotive brand that had the biggest decline from 2019 Q3 to 2019 Q4 is Fiat with a large loss of 26%.

What automotive brand had the biggest growth from 2018 Q4 to 2019 Q4?

The automotive brand that had the biggest growth from 2018 Q4 to 2019 Q4 is Genesis with a gain of 351%.

What automotive brand had the biggest decline from 2018 Q4 to 2019 Q4?

The automotive brand that had the biggest decline from 2018 Q4 to 2019 Q4 is Fiat with a large loss of 49%.

Rank Name 2019_Q4 Δ 2018_Q4 Δ 2019_Q3 Year to Date 2018_Q4 2019_Q3
1 Ford 549205 -1 3 2226513 556704 535269
2 Toyota 495742 -1 -7 2013986 498536 532075
3 Chevrolet 483807 -7 -2 1906584 519300 494467
4 Honda 350192 3 -8 1415445 340312 381618
5 Nissan 268205 -16 -10 1215277 321067 299276
6 Jeep 221536 -2 -10 923291 227033 245474
7 Ram 190655 6 6 703023 180707 179200
8 Hyundai 182345 4 5 688504 174833 172950
9 Kia 151740 10 -4 615338 137631 158754
10 GMC 146880 -9 4 564946 160525 140789
11 Subaru 134140 -1 -3 518939 135855 138985
12 Mercedes-Benz 103331 3 17 350412 100033 88624
13 BMW 90738 8 22 318870 84385 74572
14 Dodge 90641 -9 -13 422886 99596 104146
15 Lexus 88561 5 20 298109 84686 73816
16 Mazda 70385 8 1 278550 65203 69612
17 Volkswagen 65741 -15 -16 300137 77657 78144
18 Audi 63644 14 15 214900 55658 55187
19 Buick 48997 -3 -2 204391 50509 50215
20 Acura 44536 0 14 157147 44403 38995
21 Cadillac 40551 -2 1 156246 41462 39961
22 Lincoln 33355 18 19 112204 28307 27934
23 Chrysler 33005 -15 12 126971 38808 29544
24 Infiniti 29774 -32 20 117708 44031 24876
25 Land Rover 28097 4 37 94736 27010 20516
26 Volvo 25329 17 13 88163 21564 22439
27 Mitsubishi 24579 4 3 118242 23560 23808
28 Porsche 16376 5 11 61438 15552 14805
29 Jaguar 8619 -7 40 30994 9307 6150
30 Mini 8339 -12 -19 36165 9491 10243
31 Genesis 6327 351 29 21238 1403 4903
32 Alfa Romeo 4945 -12 15 18292 5640 4310
33 Fiat 1737 -49 -26 9201 3437 2361

Download Historic Sales Data
Looking for more data/visualizations? Send us an email at [email protected] for customized data aggregates and visualizations.