Last updated: January 31, 2020
us-auto-market-2019-q3-best-sellers-promo-rKBgiKPy

Key Stats

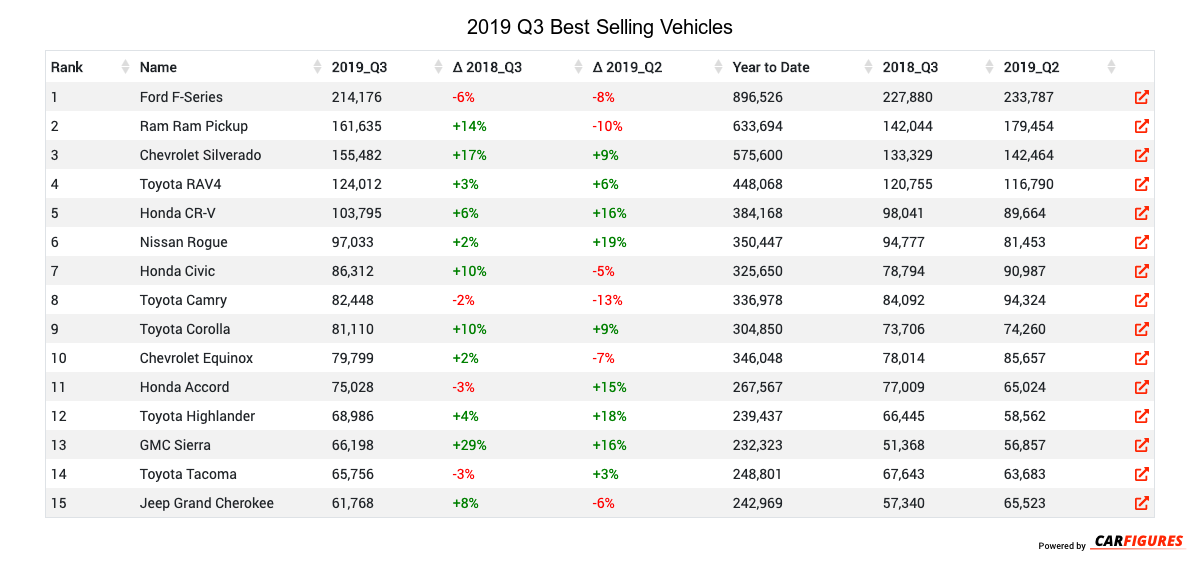
What is the best selling vehicle in 2019 Q3?

The best selling vehicle in 2019 Q3 is the Ford F-Series with 214,176 units in sales volume this quarter.

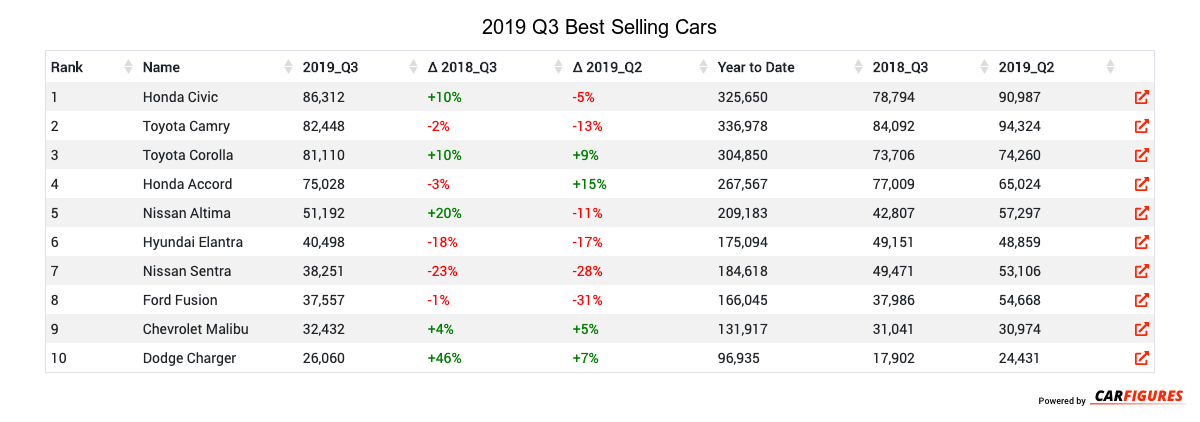
What is the best selling car in 2019 Q3?

The best selling car in 2019 Q3 is the Honda Civic with 86,312 units in sales volume this quarter.

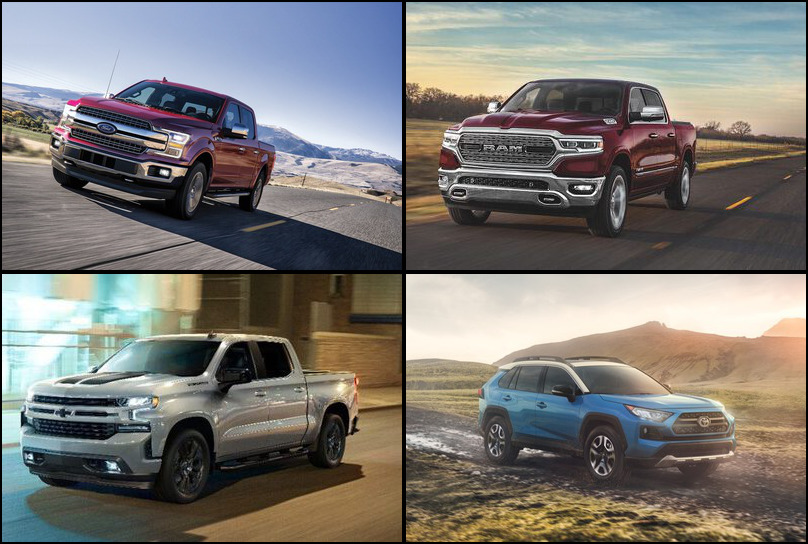
What is the best selling crossover/SUV in 2019 Q3?

The best selling crossover/SUV in 2019 Q3 is the Toyota RAV4 with 124,012 units in sales volume this quarter.

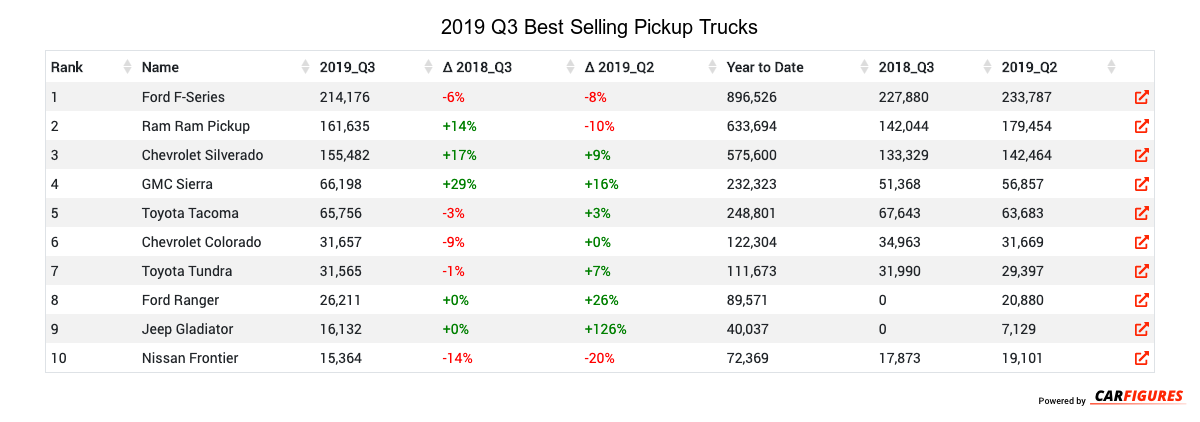
What is the best selling pickup truck in 2019 Q3?

The best selling pickup truck in 2019 Q3 is the Ford F-Series with 214,176 units in sales volume this quarter.


Rank Name 2019_Q3 Δ 2018_Q3 Δ 2019_Q2 Year to Date 2018_Q3 2019_Q2
1 Ford F-Series 214176 -6 -8 896526 227880 233787
2 Ram Ram Pickup 161635 14 -10 633694 142044 179454
3 Chevrolet Silverado 155482 17 9 575600 133329 142464
4 Toyota RAV4 124012 3 6 448068 120755 116790
5 Honda CR-V 103795 6 16 384168 98041 89664
6 Nissan Rogue 97033 2 19 350447 94777 81453
7 Honda Civic 86312 10 -5 325650 78794 90987
8 Toyota Camry 82448 -2 -13 336978 84092 94324
9 Toyota Corolla 81110 10 9 304850 73706 74260
10 Chevrolet Equinox 79799 2 -7 346048 78014 85657
11 Honda Accord 75028 -3 15 267567 77009 65024
12 Toyota Highlander 68986 4 18 239437 66445 58562
13 GMC Sierra 66198 29 16 232323 51368 56857
14 Toyota Tacoma 65756 -3 3 248801 67643 63683
15 Jeep Grand Cherokee 61768 8 -6 242969 57340 65523
Rank Name 2019_Q3 Δ 2018_Q3 Δ 2019_Q2 Year to Date 2018_Q3 2019_Q2
1 Honda Civic 86312 10 -5 325650 78794 90987
2 Toyota Camry 82448 -2 -13 336978 84092 94324
3 Toyota Corolla 81110 10 9 304850 73706 74260
4 Honda Accord 75028 -3 15 267567 77009 65024
5 Nissan Altima 51192 20 -11 209183 42807 57297
6 Hyundai Elantra 40498 -18 -17 175094 49151 48859
7 Nissan Sentra 38251 -23 -28 184618 49471 53106
8 Ford Fusion 37557 -1 -31 166045 37986 54668
9 Chevrolet Malibu 32432 4 5 131917 31041 30974
10 Dodge Charger 26060 46 7 96935 17902 24431
Rank Name 2019_Q3 Δ 2018_Q3 Δ 2019_Q2 Year to Date 2018_Q3 2019_Q2
1 Toyota RAV4 124012 3 6 448068 120755 116790
2 Honda CR-V 103795 6 16 384168 98041 89664
3 Nissan Rogue 97033 2 19 350447 94777 81453
4 Chevrolet Equinox 79799 2 -7 346048 78014 85657
5 Toyota Highlander 68986 4 18 239437 66445 58562
6 Jeep Grand Cherokee 61768 8 -6 242969 57340 65523
7 Ford Escape 60701 -7 -16 241388 65423 72398
8 Jeep Wrangler 59035 3 -12 228042 57459 67007
9 Jeep Cherokee 52139 -21 9 191397 66024 47790
10 Subaru Forester 45228 6 -1 180179 42647 45563
Rank Name 2019_Q3 Δ 2018_Q3 Δ 2019_Q2 Year to Date 2018_Q3 2019_Q2
1 Ford F-Series 214176 -6 -8 896526 227880 233787
2 Ram Ram Pickup 161635 14 -10 633694 142044 179454
3 Chevrolet Silverado 155482 17 9 575600 133329 142464
4 GMC Sierra 66198 29 16 232323 51368 56857
5 Toyota Tacoma 65756 -3 3 248801 67643 63683
6 Chevrolet Colorado 31657 -9 0 122304 34963 31669
7 Toyota Tundra 31565 -1 7 111673 31990 29397
8 Ford Ranger 26211 0 26 89571 0 20880
9 Jeep Gladiator 16132 0 126 40037 0 7129
10 Nissan Frontier 15364 -14 -20 72369 17873 19101

Download Historic Sales Data
Looking for more data/visualizations? Send us an email at [email protected] for customized data aggregates and visualizations.