Last updated: January 31, 2020

Total Sales


Key Stats

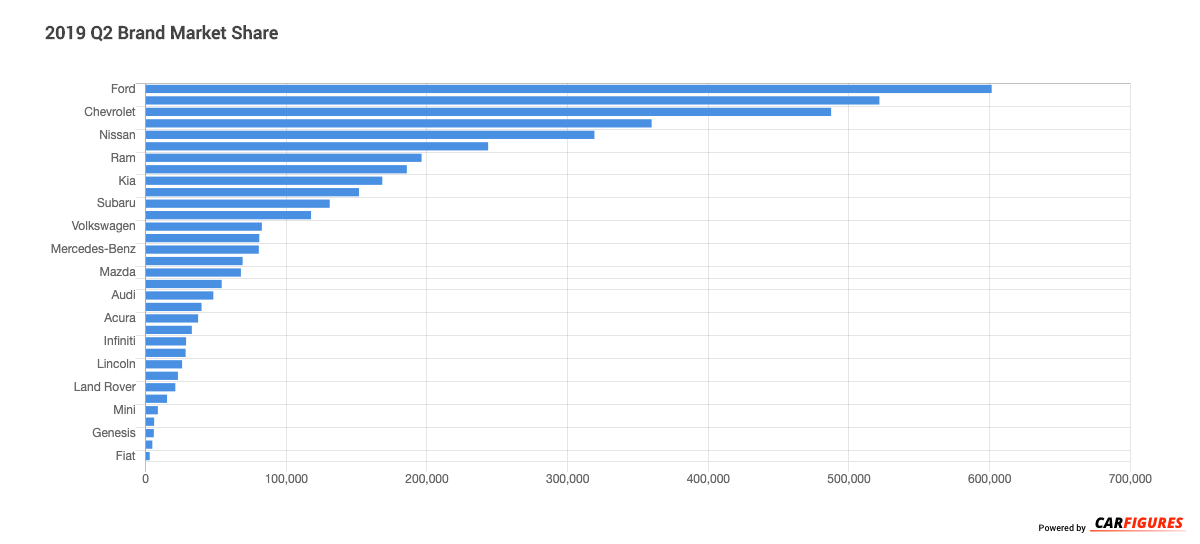
What automotive brand sold the most vehicles in 2019 Q2?

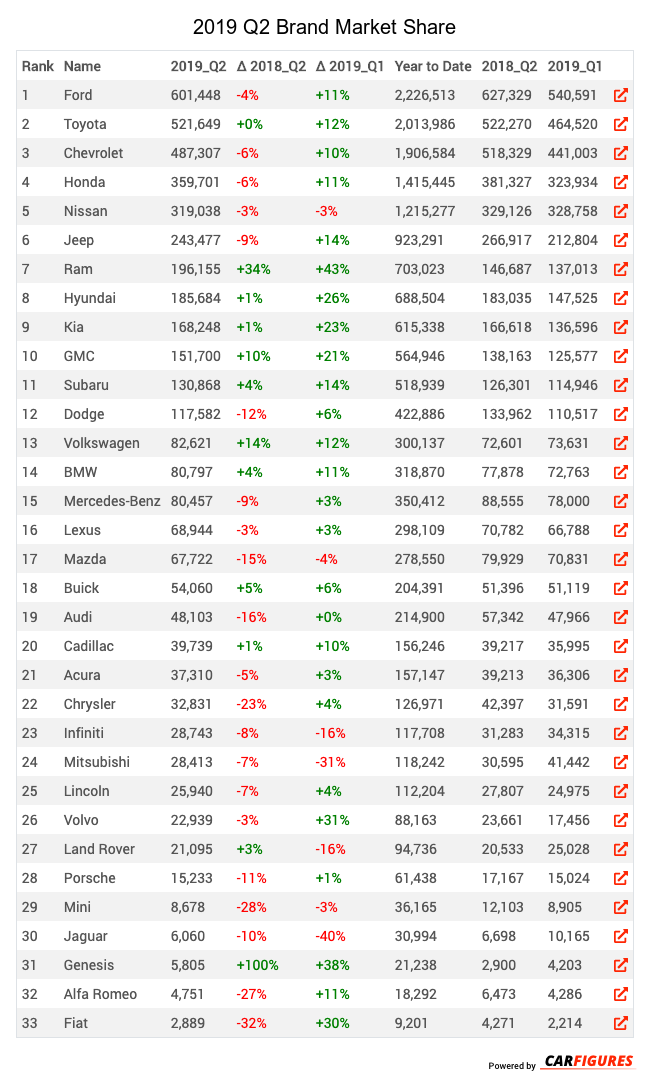
The brand that sold the most vehicles in 2019 Q2 is Ford with 601,448 units in sales volume this quarter.

What automotive brand had the biggest growth from 2019 Q1 to 2019 Q2?

The automotive brand that had the biggest growth from 2018 Q1 to 2019 Q2 is Ram with a gain of 43%.

What automotive brand had the biggest decline from 2019 Q1 to 2019 Q2?

The automotive brand that had the biggest decline from 2019 Q1 to 2019 Q2 is Jaguar with a large loss of 40%.

What automotive brand had the biggest growth from 2018 Q2 to 2019 Q2?

The automotive brand that had the biggest growth from 2018 Q2 to 2019 Q2 is Genesis with a gain of 100%.

What automotive brand had the biggest decline from 2018 Q2 to 2019 Q2?

The automotive brand that had the biggest decline from 2018 Q2 to 2019 Q2 is Fiat with a large loss of 32%.


Rank Name 2019_Q2 Δ 2018_Q2 Δ 2019_Q1 Year to Date 2018_Q2 2019_Q1
1 Ford 601448 -4 11 2226513 627329 540591
2 Toyota 521649 0 12 2013986 522270 464520
3 Chevrolet 487307 -6 10 1906584 518329 441003
4 Honda 359701 -6 11 1415445 381327 323934
5 Nissan 319038 -3 -3 1215277 329126 328758
6 Jeep 243477 -9 14 923291 266917 212804
7 Ram 196155 34 43 703023 146687 137013
8 Hyundai 185684 1 26 688504 183035 147525
9 Kia 168248 1 23 615338 166618 136596
10 GMC 151700 10 21 564946 138163 125577
11 Subaru 130868 4 14 518939 126301 114946
12 Dodge 117582 -12 6 422886 133962 110517
13 Volkswagen 82621 14 12 300137 72601 73631
14 BMW 80797 4 11 318870 77878 72763
15 Mercedes-Benz 80457 -9 3 350412 88555 78000
16 Lexus 68944 -3 3 298109 70782 66788
17 Mazda 67722 -15 -4 278550 79929 70831
18 Buick 54060 5 6 204391 51396 51119
19 Audi 48103 -16 0 214900 57342 47966
20 Cadillac 39739 1 10 156246 39217 35995
21 Acura 37310 -5 3 157147 39213 36306
22 Chrysler 32831 -23 4 126971 42397 31591
23 Infiniti 28743 -8 -16 117708 31283 34315
24 Mitsubishi 28413 -7 -31 118242 30595 41442
25 Lincoln 25940 -7 4 112204 27807 24975
26 Volvo 22939 -3 31 88163 23661 17456
27 Land Rover 21095 3 -16 94736 20533 25028
28 Porsche 15233 -11 1 61438 17167 15024
29 Mini 8678 -28 -3 36165 12103 8905
30 Jaguar 6060 -10 -40 30994 6698 10165
31 Genesis 5805 100 38 21238 2900 4203
32 Alfa Romeo 4751 -27 11 18292 6473 4286
33 Fiat 2889 -32 30 9201 4271 2214

Download Historic Sales Data
Looking for more data/visualizations? Send us an email at [email protected] for customized data aggregates and visualizations.