Last updated: January 31, 2020
us-auto-market-2018-q3-best-sellers-promo-SuHNFEMw

Key Stats

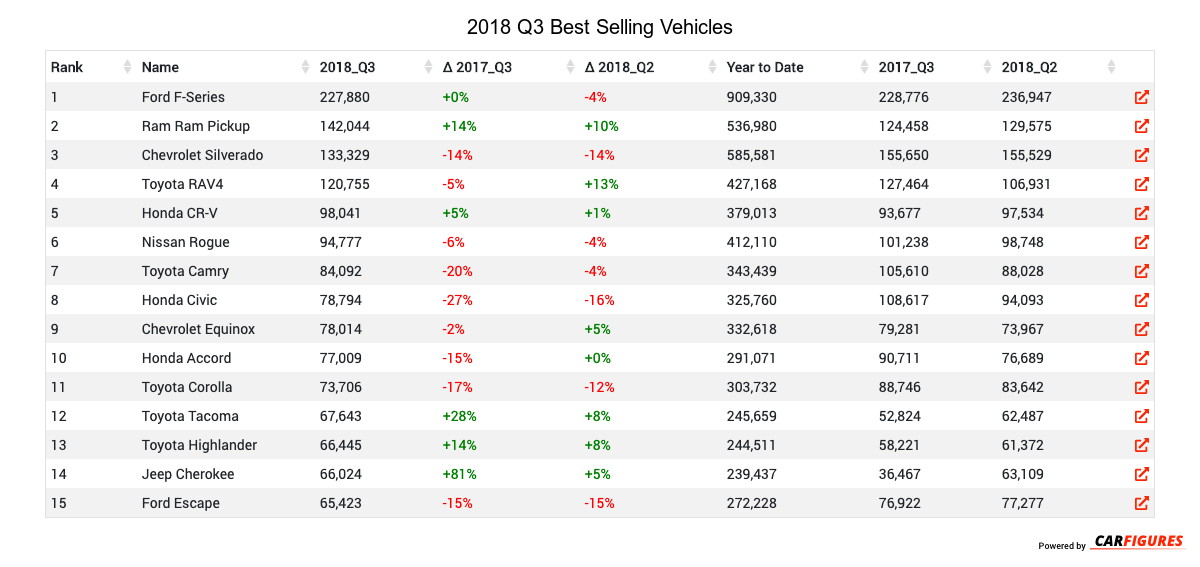
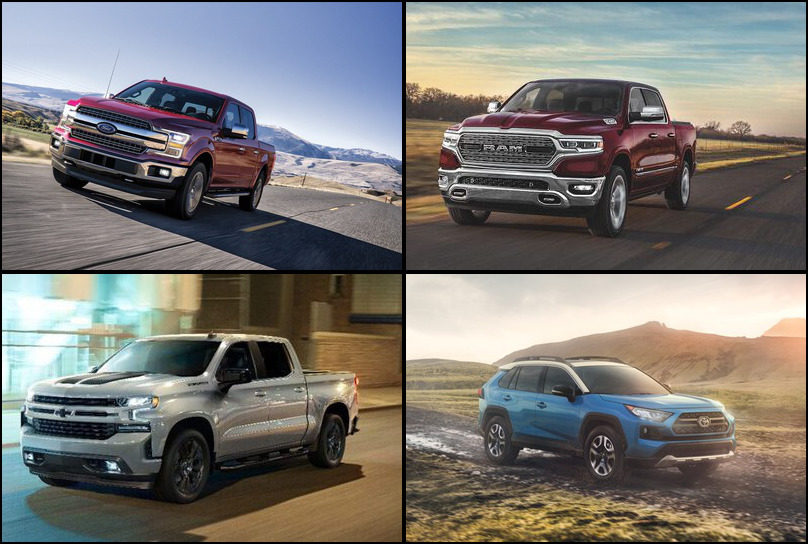
What is the best selling vehicle in 2018 Q3?

The best selling vehicle in 2018 Q3 is the Ford F-Series with 227,880 units in sales volume this quarter.

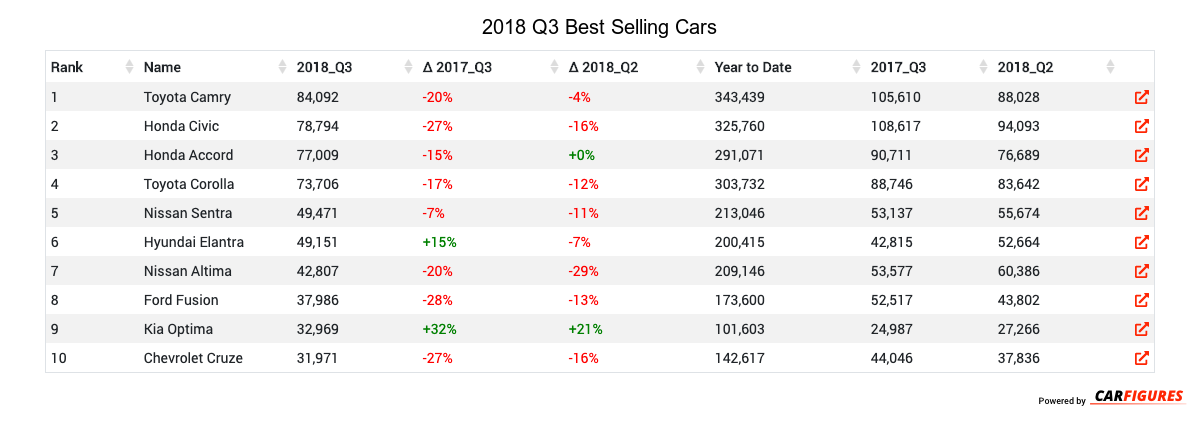
What is the best selling car in 2018 Q3?

The best selling car in 2018 Q3 is the Toyota Camry with 84,092 units in sales volume this quarter.

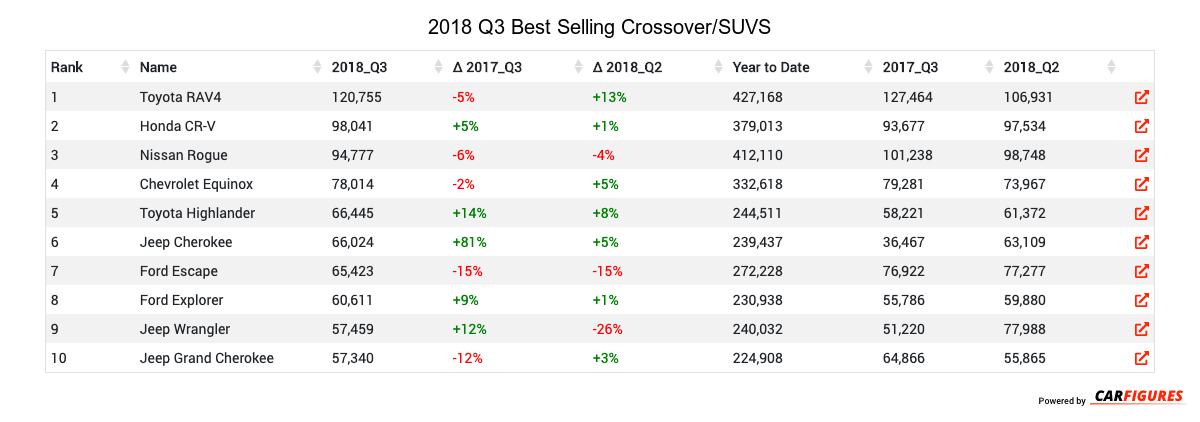
What is the best selling crossover/SUV in 2018 Q3?

The best selling crossover/SUV in 2018 Q3 is the Toyota RAV4 with 120,755 units in sales volume this quarter.

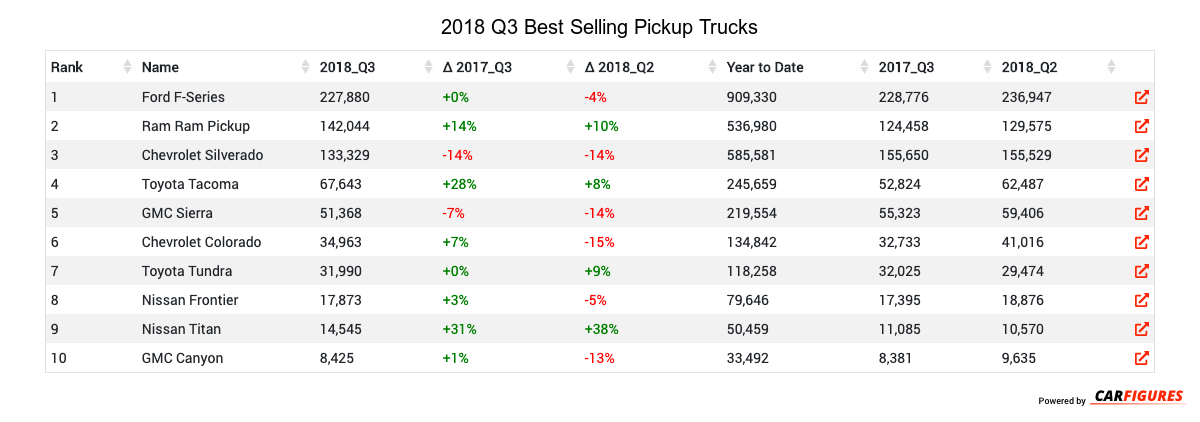
What is the best selling pickup truck in 2018 Q3?

The best selling pickup truck in 2018 Q3 is the Ford F-Series with 227,880 units in sales volume this quarter.


Rank Name 2018_Q3 Δ 2017_Q3 Δ 2018_Q2 Year to Date 2017_Q3 2018_Q2
1 Ford F-Series 227880 0 -4 909330 228776 236947
2 Ram Ram Pickup 142044 14 10 536980 124458 129575
3 Chevrolet Silverado 133329 -14 -14 585581 155650 155529
4 Toyota RAV4 120755 -5 13 427168 127464 106931
5 Honda CR-V 98041 5 1 379013 93677 97534
6 Nissan Rogue 94777 -6 -4 412110 101238 98748
7 Toyota Camry 84092 -20 -4 343439 105610 88028
8 Honda Civic 78794 -27 -16 325760 108617 94093
9 Chevrolet Equinox 78014 -2 5 332618 79281 73967
10 Honda Accord 77009 -15 0 291071 90711 76689
11 Toyota Corolla 73706 -17 -12 303732 88746 83642
12 Toyota Tacoma 67643 28 8 245659 52824 62487
13 Toyota Highlander 66445 14 8 244511 58221 61372
14 Jeep Cherokee 66024 81 5 239437 36467 63109
15 Ford Escape 65423 -15 -15 272228 76922 77277
Rank Name 2018_Q3 Δ 2017_Q3 Δ 2018_Q2 Year to Date 2017_Q3 2018_Q2
1 Toyota Camry 84092 -20 -4 343439 105610 88028
2 Honda Civic 78794 -27 -16 325760 108617 94093
3 Honda Accord 77009 -15 0 291071 90711 76689
4 Toyota Corolla 73706 -17 -12 303732 88746 83642
5 Nissan Sentra 49471 -7 -11 213046 53137 55674
6 Hyundai Elantra 49151 15 -7 200415 42815 52664
7 Nissan Altima 42807 -20 -29 209146 53577 60386
8 Ford Fusion 37986 -28 -13 173600 52517 43802
9 Kia Optima 32969 32 21 101603 24987 27266
10 Chevrolet Cruze 31971 -27 -16 142617 44046 37836
Rank Name 2018_Q3 Δ 2017_Q3 Δ 2018_Q2 Year to Date 2017_Q3 2018_Q2
1 Toyota RAV4 120755 -5 13 427168 127464 106931
2 Honda CR-V 98041 5 1 379013 93677 97534
3 Nissan Rogue 94777 -6 -4 412110 101238 98748
4 Chevrolet Equinox 78014 -2 5 332618 79281 73967
5 Toyota Highlander 66445 14 8 244511 58221 61372
6 Jeep Cherokee 66024 81 5 239437 36467 63109
7 Ford Escape 65423 -15 -15 272228 76922 77277
8 Ford Explorer 60611 9 1 230938 55786 59880
9 Jeep Wrangler 57459 12 -26 240032 51220 77988
10 Jeep Grand Cherokee 57340 -12 3 224908 64866 55865
Rank Name 2018_Q3 Δ 2017_Q3 Δ 2018_Q2 Year to Date 2017_Q3 2018_Q2
1 Ford F-Series 227880 0 -4 909330 228776 236947
2 Ram Ram Pickup 142044 14 10 536980 124458 129575
3 Chevrolet Silverado 133329 -14 -14 585581 155650 155529
4 Toyota Tacoma 67643 28 8 245659 52824 62487
5 GMC Sierra 51368 -7 -14 219554 55323 59406
6 Chevrolet Colorado 34963 7 -15 134842 32733 41016
7 Toyota Tundra 31990 0 9 118258 32025 29474
8 Nissan Frontier 17873 3 -5 79646 17395 18876
9 Nissan Titan 14545 31 38 50459 11085 10570
10 GMC Canyon 8425 1 -13 33492 8381 9635

Download Historic Sales Data
Looking for more data/visualizations? Send us an email at [email protected] for customized data aggregates and visualizations.