Last updated: January 31, 2020

Total Sales


Key Stats

What automotive brand sold the most vehicles in 2018 Q2?

The brand that sold the most vehicles in 2018 Q2 is Ford with 627,329 units in sales volume this quarter.

What automotive brand had the biggest growth from 2018 Q1 to 2018 Q2?

The automotive brand that had the biggest growth from 2017 Q1 to 2018 Q2 is Volvo with a gain of 47%.

What automotive brand had the biggest decline from 2018 Q1 to 2018 Q2?

The automotive brand that had the biggest decline from 2018 Q1 to 2018 Q2 is Genesis with a large loss of 34%.

What automotive brand had the biggest growth from 2017 Q2 to 2018 Q2?

The automotive brand that had the biggest growth from 2017 Q2 to 2018 Q2 is Alfa Romeo with a gain of 148%.

What automotive brand had the biggest decline from 2017 Q2 to 2018 Q2?

The automotive brand that had the biggest decline from 2017 Q2 to 2018 Q2 is Fiat with a large loss of 43%.

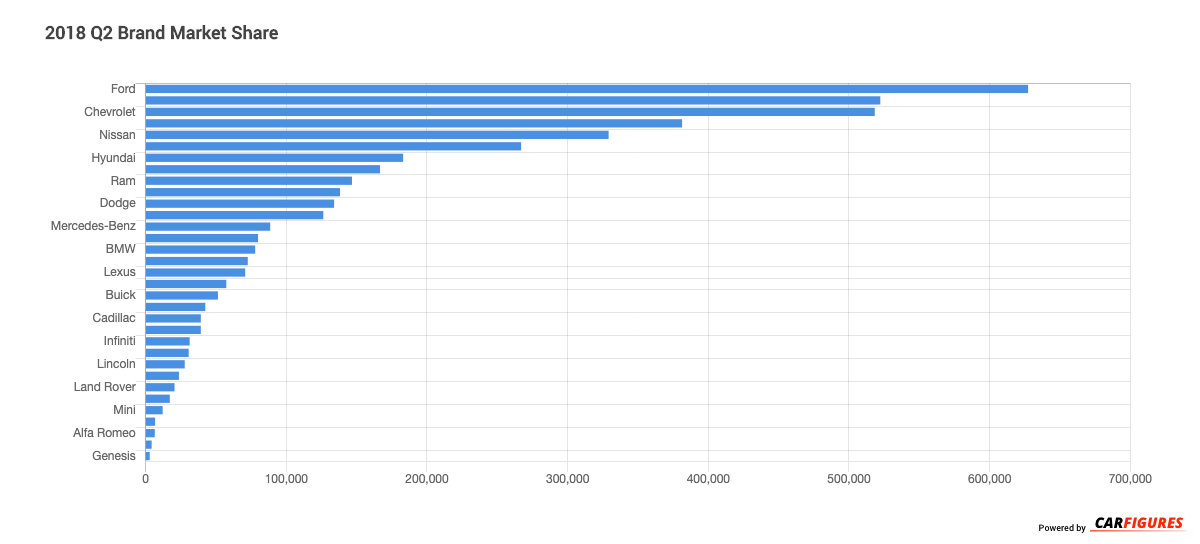
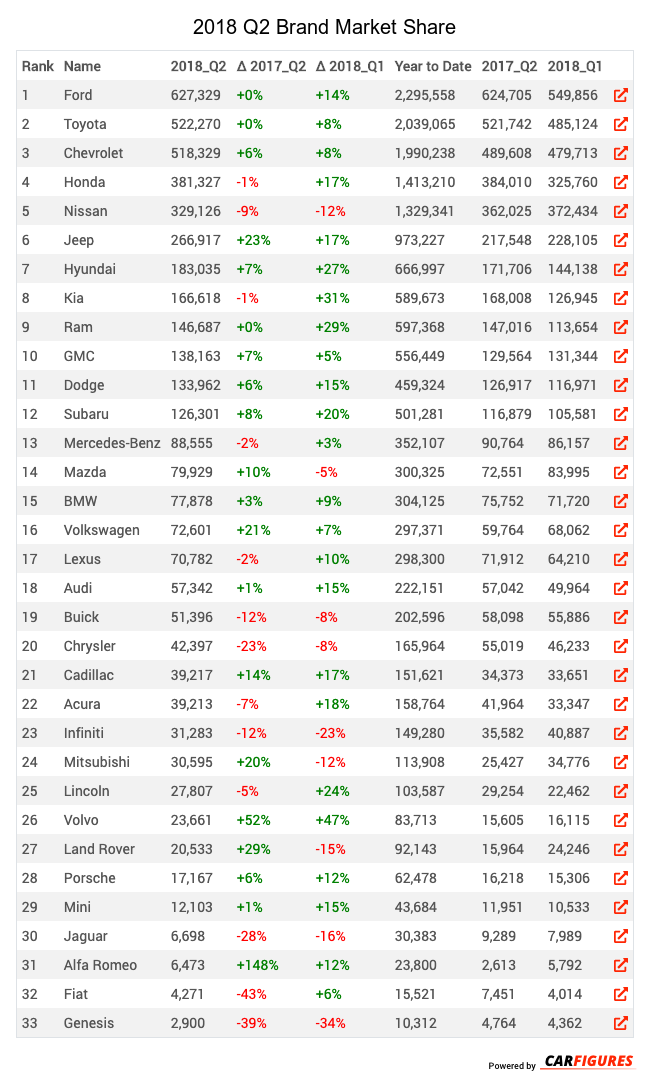
Rank Name 2018_Q2 Δ 2017_Q2 Δ 2018_Q1 Year to Date 2017_Q2 2018_Q1
1 Ford 627329 0 14 2295558 624705 549856
2 Toyota 522270 0 8 2039065 521742 485124
3 Chevrolet 518329 6 8 1990238 489608 479713
4 Honda 381327 -1 17 1413210 384010 325760
5 Nissan 329126 -9 -12 1329341 362025 372434
6 Jeep 266917 23 17 973227 217548 228105
7 Hyundai 183035 7 27 666997 171706 144138
8 Kia 166618 -1 31 589673 168008 126945
9 Ram 146687 0 29 597368 147016 113654
10 GMC 138163 7 5 556449 129564 131344
11 Dodge 133962 6 15 459324 126917 116971
12 Subaru 126301 8 20 501281 116879 105581
13 Mercedes-Benz 88555 -2 3 352107 90764 86157
14 Mazda 79929 10 -5 300325 72551 83995
15 BMW 77878 3 9 304125 75752 71720
16 Volkswagen 72601 21 7 297371 59764 68062
17 Lexus 70782 -2 10 298300 71912 64210
18 Audi 57342 1 15 222151 57042 49964
19 Buick 51396 -12 -8 202596 58098 55886
20 Chrysler 42397 -23 -8 165964 55019 46233
21 Cadillac 39217 14 17 151621 34373 33651
22 Acura 39213 -7 18 158764 41964 33347
23 Infiniti 31283 -12 -23 149280 35582 40887
24 Mitsubishi 30595 20 -12 113908 25427 34776
25 Lincoln 27807 -5 24 103587 29254 22462
26 Volvo 23661 52 47 83713 15605 16115
27 Land Rover 20533 29 -15 92143 15964 24246
28 Porsche 17167 6 12 62478 16218 15306
29 Mini 12103 1 15 43684 11951 10533
30 Jaguar 6698 -28 -16 30383 9289 7989
31 Alfa Romeo 6473 148 12 23800 2613 5792
32 Fiat 4271 -43 6 15521 7451 4014
33 Genesis 2900 -39 -34 10312 4764 4362

Download Historic Sales Data
Looking for more data/visualizations? Send us an email at [email protected] for customized data aggregates and visualizations.