Last updated: January 31, 2020
us-auto-market-2018-q1-best-sellers-promo-YbalUgNy

Key Stats

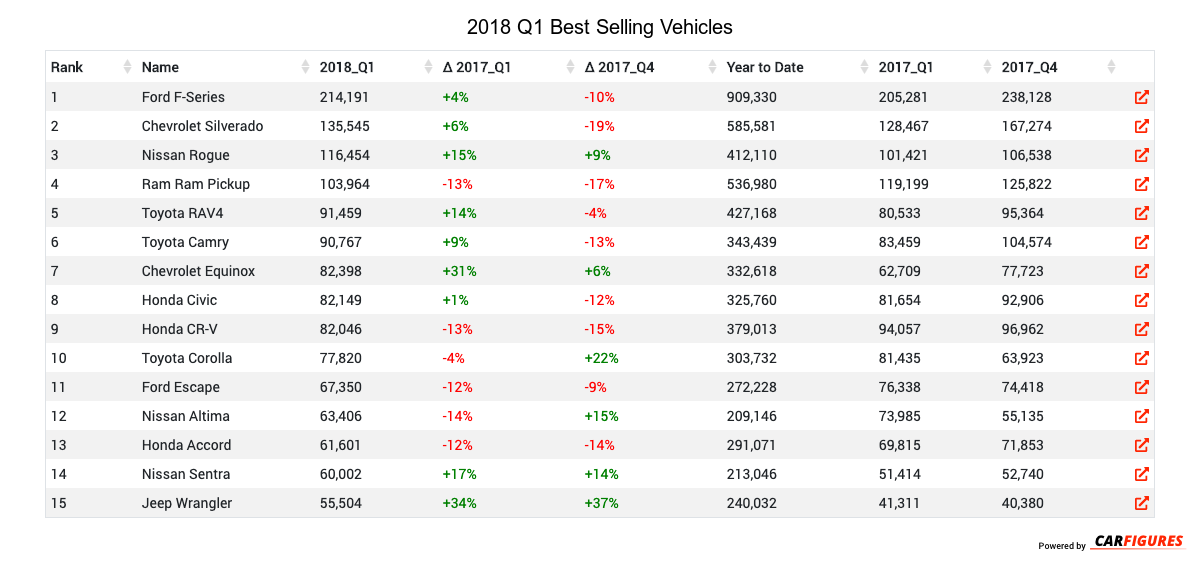
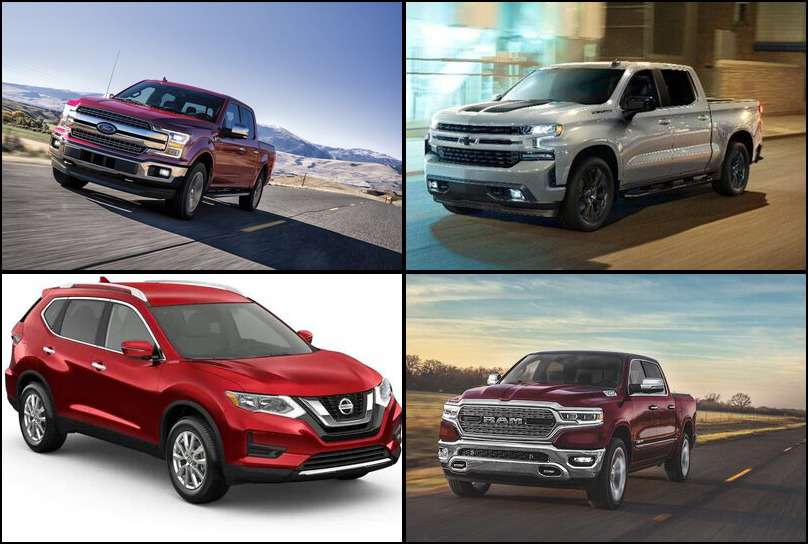
What is the best selling vehicle in 2018 Q1?

The best selling vehicle in 2018 Q1 is the Ford F-Series with 214,191 units in sales volume this quarter.

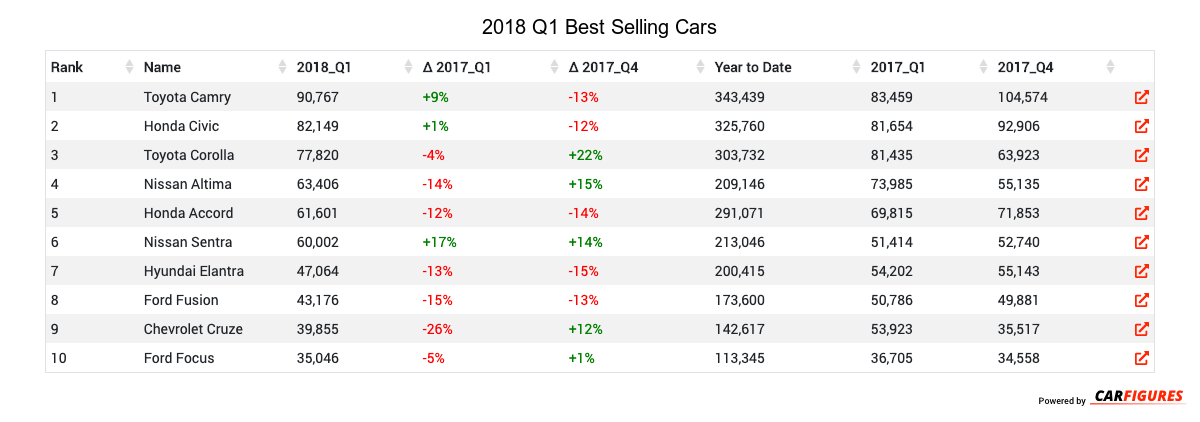
What is the best selling car in 2018 Q1?

The best selling car in 2018 Q1 is the Toyota Camry with 90,767 units in sales volume this quarter.

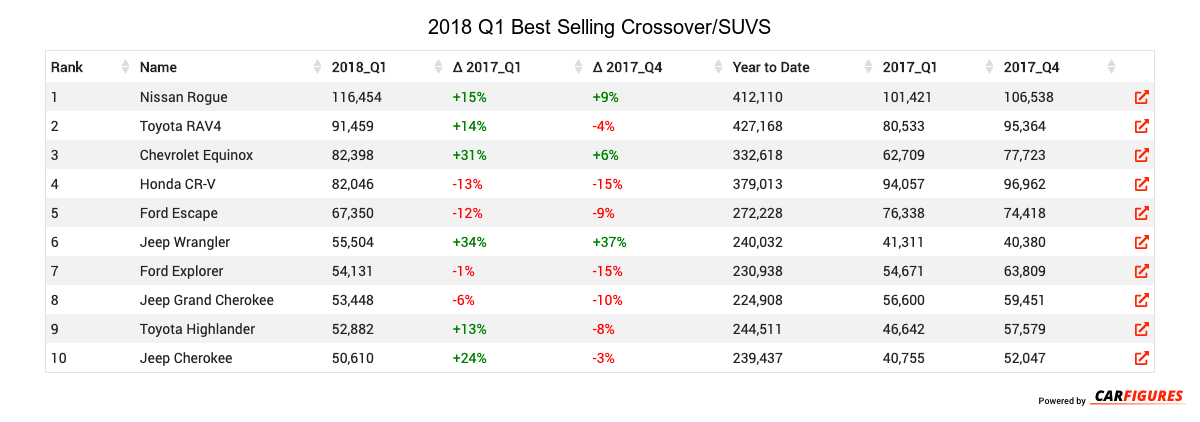
What is the best selling crossover/SUV in 2018 Q1?

The best selling crossover/SUV in 2018 Q1 is the Nissan Rogue with 116,454 units in sales volume this quarter.

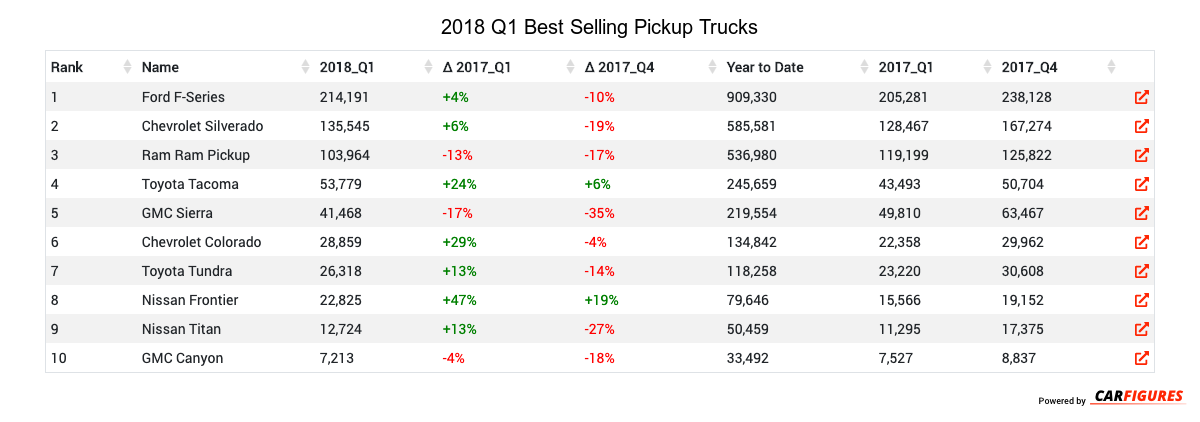
What is the best selling pickup truck in 2018 Q1?

The best selling pickup truck in 2018 Q1 is the Ford F-Series with 214,191 units in sales volume this quarter.


Rank Name 2018_Q1 Δ 2017_Q1 Δ 2017_Q4 Year to Date 2017_Q1 2017_Q4
1 Ford F-Series 214191 4 -10 909330 205281 238128
2 Chevrolet Silverado 135545 6 -19 585581 128467 167274
3 Nissan Rogue 116454 15 9 412110 101421 106538
4 Ram Ram Pickup 103964 -13 -17 536980 119199 125822
5 Toyota RAV4 91459 14 -4 427168 80533 95364
6 Toyota Camry 90767 9 -13 343439 83459 104574
7 Chevrolet Equinox 82398 31 6 332618 62709 77723
8 Honda Civic 82149 1 -12 325760 81654 92906
9 Honda CR-V 82046 -13 -15 379013 94057 96962
10 Toyota Corolla 77820 -4 22 303732 81435 63923
11 Ford Escape 67350 -12 -9 272228 76338 74418
12 Nissan Altima 63406 -14 15 209146 73985 55135
13 Honda Accord 61601 -12 -14 291071 69815 71853
14 Nissan Sentra 60002 17 14 213046 51414 52740
15 Jeep Wrangler 55504 34 37 240032 41311 40380
Rank Name 2018_Q1 Δ 2017_Q1 Δ 2017_Q4 Year to Date 2017_Q1 2017_Q4
1 Toyota Camry 90767 9 -13 343439 83459 104574
2 Honda Civic 82149 1 -12 325760 81654 92906
3 Toyota Corolla 77820 -4 22 303732 81435 63923
4 Nissan Altima 63406 -14 15 209146 73985 55135
5 Honda Accord 61601 -12 -14 291071 69815 71853
6 Nissan Sentra 60002 17 14 213046 51414 52740
7 Hyundai Elantra 47064 -13 -15 200415 54202 55143
8 Ford Fusion 43176 -15 -13 173600 50786 49881
9 Chevrolet Cruze 39855 -26 12 142617 53923 35517
10 Ford Focus 35046 -5 1 113345 36705 34558
Rank Name 2018_Q1 Δ 2017_Q1 Δ 2017_Q4 Year to Date 2017_Q1 2017_Q4
1 Nissan Rogue 116454 15 9 412110 101421 106538
2 Toyota RAV4 91459 14 -4 427168 80533 95364
3 Chevrolet Equinox 82398 31 6 332618 62709 77723
4 Honda CR-V 82046 -13 -15 379013 94057 96962
5 Ford Escape 67350 -12 -9 272228 76338 74418
6 Jeep Wrangler 55504 34 37 240032 41311 40380
7 Ford Explorer 54131 -1 -15 230938 54671 63809
8 Jeep Grand Cherokee 53448 -6 -10 224908 56600 59451
9 Toyota Highlander 52882 13 -8 244511 46642 57579
10 Jeep Cherokee 50610 24 -3 239437 40755 52047
Rank Name 2018_Q1 Δ 2017_Q1 Δ 2017_Q4 Year to Date 2017_Q1 2017_Q4
1 Ford F-Series 214191 4 -10 909330 205281 238128
2 Chevrolet Silverado 135545 6 -19 585581 128467 167274
3 Ram Ram Pickup 103964 -13 -17 536980 119199 125822
4 Toyota Tacoma 53779 24 6 245659 43493 50704
5 GMC Sierra 41468 -17 -35 219554 49810 63467
6 Chevrolet Colorado 28859 29 -4 134842 22358 29962
7 Toyota Tundra 26318 13 -14 118258 23220 30608
8 Nissan Frontier 22825 47 19 79646 15566 19152
9 Nissan Titan 12724 13 -27 50459 11295 17375
10 GMC Canyon 7213 -4 -18 33492 7527 8837

Download Historic Sales Data
Looking for more data/visualizations? Send us an email at [email protected] for customized data aggregates and visualizations.