Last updated: January 31, 2020
us-auto-market-2017-q3-best-sellers-promo-zINbKmnj

Key Stats

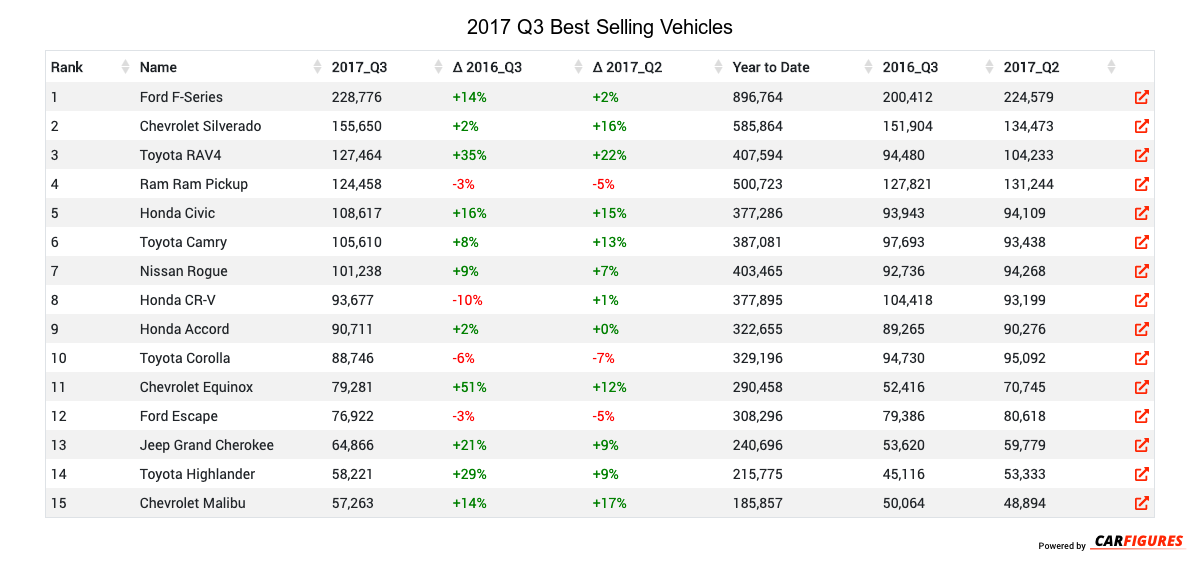
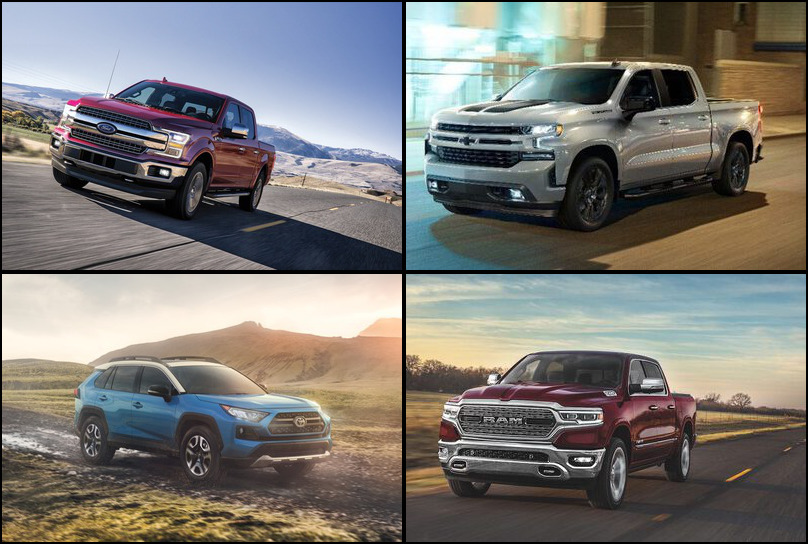
What is the best selling vehicle in 2017 Q3?

The best selling vehicle in 2017 Q3 is the Ford F-Series with 228,776 units in sales volume this quarter.

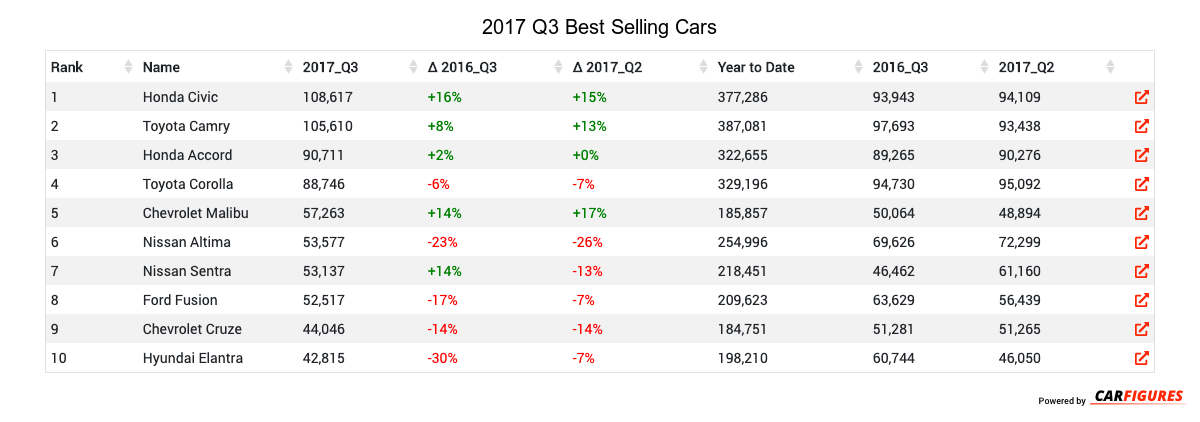
What is the best selling car in 2017 Q3?

The best selling car in 2017 Q3 is the Honda Civic with 108,617 units in sales volume this quarter.

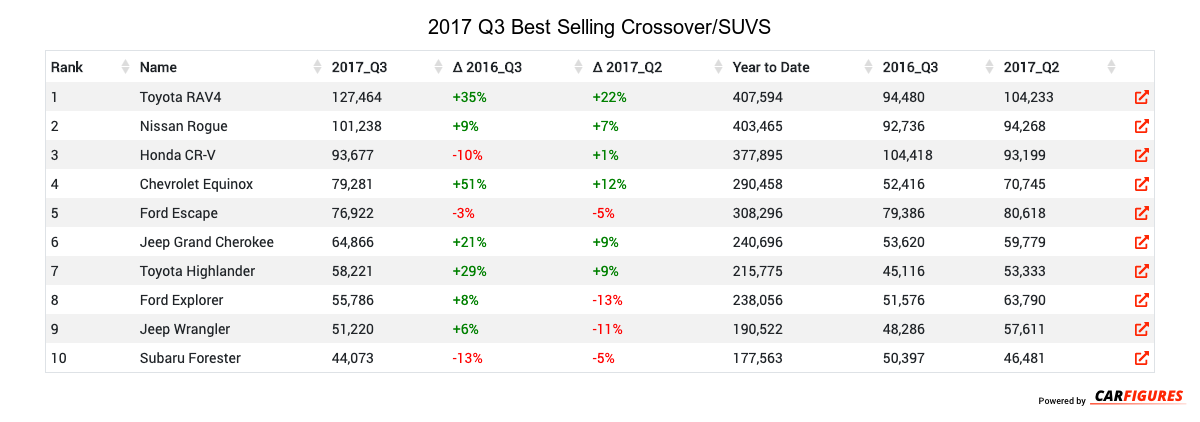
What is the best selling crossover/SUV in 2017 Q3?

The best selling crossover/SUV in 2017 Q3 is the Toyota RAV4 with 127,464 units in sales volume this quarter.

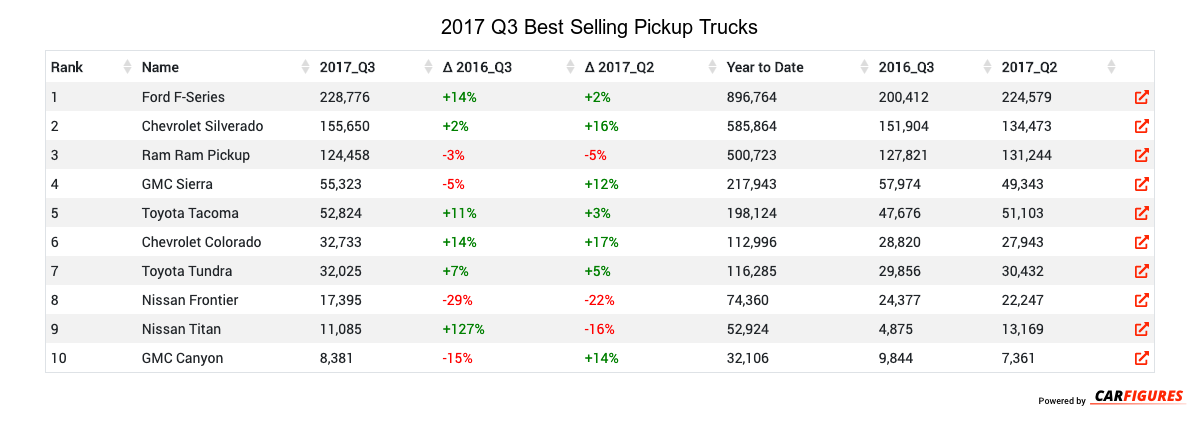
What is the best selling pickup truck in 2017 Q3?

The best selling pickup truck in 2017 Q3 is the Ford F-Series with 228,776 units in sales volume this quarter.


Rank Name 2017_Q3 Δ 2016_Q3 Δ 2017_Q2 Year to Date 2016_Q3 2017_Q2
1 Ford F-Series 228776 14 2 896764 200412 224579
2 Chevrolet Silverado 155650 2 16 585864 151904 134473
3 Toyota RAV4 127464 35 22 407594 94480 104233
4 Ram Ram Pickup 124458 -3 -5 500723 127821 131244
5 Honda Civic 108617 16 15 377286 93943 94109
6 Toyota Camry 105610 8 13 387081 97693 93438
7 Nissan Rogue 101238 9 7 403465 92736 94268
8 Honda CR-V 93677 -10 1 377895 104418 93199
9 Honda Accord 90711 2 0 322655 89265 90276
10 Toyota Corolla 88746 -6 -7 329196 94730 95092
11 Chevrolet Equinox 79281 51 12 290458 52416 70745
12 Ford Escape 76922 -3 -5 308296 79386 80618
13 Jeep Grand Cherokee 64866 21 9 240696 53620 59779
14 Toyota Highlander 58221 29 9 215775 45116 53333
15 Chevrolet Malibu 57263 14 17 185857 50064 48894
Rank Name 2017_Q3 Δ 2016_Q3 Δ 2017_Q2 Year to Date 2016_Q3 2017_Q2
1 Honda Civic 108617 16 15 377286 93943 94109
2 Toyota Camry 105610 8 13 387081 97693 93438
3 Honda Accord 90711 2 0 322655 89265 90276
4 Toyota Corolla 88746 -6 -7 329196 94730 95092
5 Chevrolet Malibu 57263 14 17 185857 50064 48894
6 Nissan Altima 53577 -23 -26 254996 69626 72299
7 Nissan Sentra 53137 14 -13 218451 46462 61160
8 Ford Fusion 52517 -17 -7 209623 63629 56439
9 Chevrolet Cruze 44046 -14 -14 184751 51281 51265
10 Hyundai Elantra 42815 -30 -7 198210 60744 46050
Rank Name 2017_Q3 Δ 2016_Q3 Δ 2017_Q2 Year to Date 2016_Q3 2017_Q2
1 Toyota RAV4 127464 35 22 407594 94480 104233
2 Nissan Rogue 101238 9 7 403465 92736 94268
3 Honda CR-V 93677 -10 1 377895 104418 93199
4 Chevrolet Equinox 79281 51 12 290458 52416 70745
5 Ford Escape 76922 -3 -5 308296 79386 80618
6 Jeep Grand Cherokee 64866 21 9 240696 53620 59779
7 Toyota Highlander 58221 29 9 215775 45116 53333
8 Ford Explorer 55786 8 -13 238056 51576 63790
9 Jeep Wrangler 51220 6 -11 190522 48286 57611
10 Subaru Forester 44073 -13 -5 177563 50397 46481
Rank Name 2017_Q3 Δ 2016_Q3 Δ 2017_Q2 Year to Date 2016_Q3 2017_Q2
1 Ford F-Series 228776 14 2 896764 200412 224579
2 Chevrolet Silverado 155650 2 16 585864 151904 134473
3 Ram Ram Pickup 124458 -3 -5 500723 127821 131244
4 GMC Sierra 55323 -5 12 217943 57974 49343
5 Toyota Tacoma 52824 11 3 198124 47676 51103
6 Chevrolet Colorado 32733 14 17 112996 28820 27943
7 Toyota Tundra 32025 7 5 116285 29856 30432
8 Nissan Frontier 17395 -29 -22 74360 24377 22247
9 Nissan Titan 11085 127 -16 52924 4875 13169
10 GMC Canyon 8381 -15 14 32106 9844 7361

Download Historic Sales Data
Looking for more data/visualizations? Send us an email at [email protected] for customized data aggregates and visualizations.