Last updated: January 31, 2020
Key Stats
What automotive manufacturer sold the most vehicles in 2013 Q4?
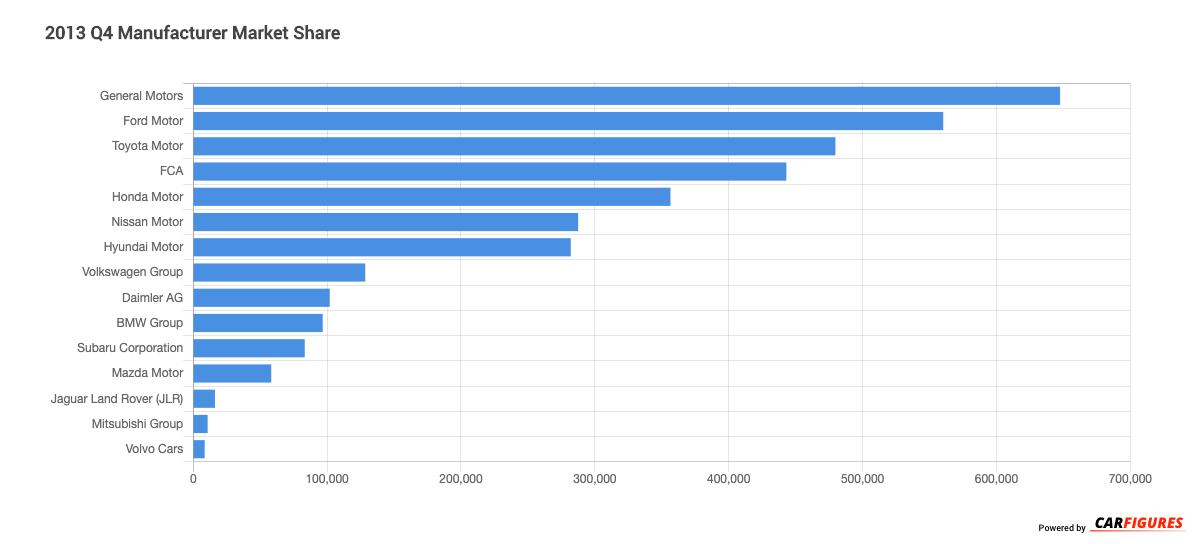
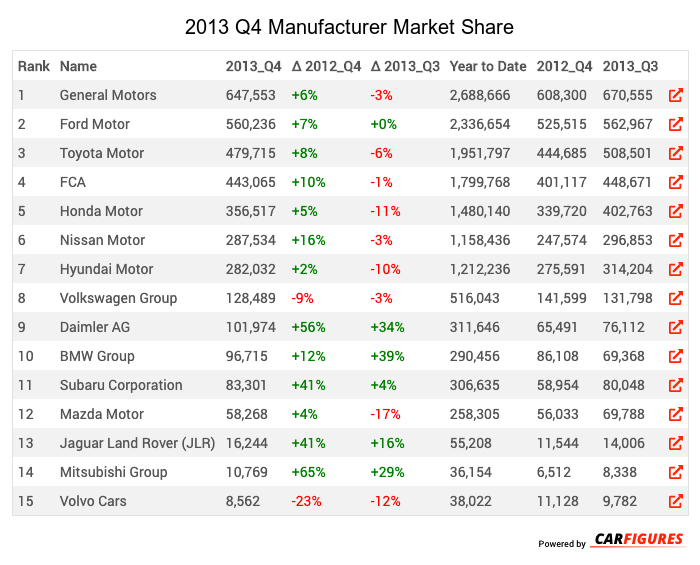
The manufacturer that sold the most vehicles in 2013 Q4 is General Motors with 647,553 units in sales volume this quarter.
What automotive manufacturer had the biggest growth from 2013 Q3 to 2013 Q4?
The automotive manufacturer that had the biggest growth from 2012 Q3 to 2013 Q4 is BMW Group with a gain of 39%.
What automotive manufacturer had the biggest decline from 2013 Q3 to 2013 Q4?
The automotive manufacturer that had the biggest decline from 2013 Q3 to 2013 Q4 is Mazda Motor with a large loss of 17%.
What automotive manufacturer had the biggest growth from 2012 Q4 to 2013 Q4?
The automotive manufacturer that had the biggest growth from 2012 Q4 to 2013 Q4 is Mitsubishi Group with a gain of 65%.
What automotive manufacturer had the biggest decline from 2012 Q4 to 2013 Q4?
The automotive manufacturer that had the biggest decline from 2012 Q4 to 2013 Q4 is Volvo Cars with a large loss of 23%.
Download Historic Sales Data