Last updated: January 31, 2020

Total Sales


Key Stats

What automotive brand sold the most vehicles in 2012 Q4?

The brand that sold the most vehicles in 2012 Q4 is Ford with 507,245 units in sales volume this quarter.

What automotive brand had the biggest growth from 2012 Q3 to 2012 Q4?

The automotive brand that had the biggest growth from 2011 Q3 to 2012 Q4 is Infiniti with a gain of 73%.

What automotive brand had the biggest decline from 2012 Q3 to 2012 Q4?

The automotive brand that had the biggest decline from 2012 Q3 to 2012 Q4 is Jaguar with a large loss of 23%.

What automotive brand had the biggest growth from 2011 Q4 to 2012 Q4?

The automotive brand that had the biggest growth from 2011 Q4 to 2012 Q4 is Fiat with a gain of 87%.

What automotive brand had the biggest decline from 2011 Q4 to 2012 Q4?

The automotive brand that had the biggest decline from 2011 Q4 to 2012 Q4 is Jaguar with a large loss of 29%.

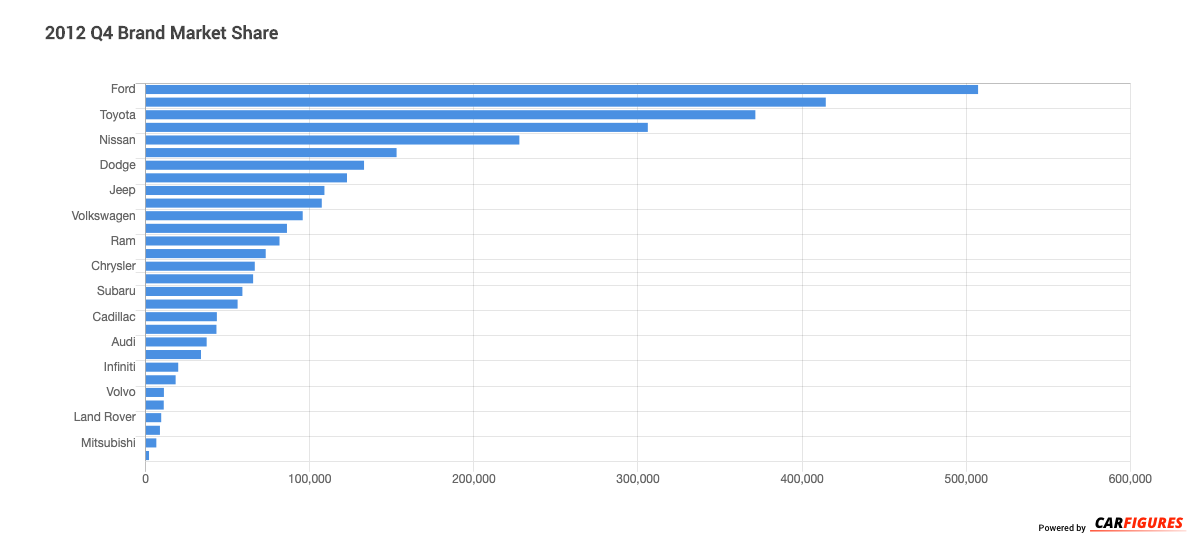
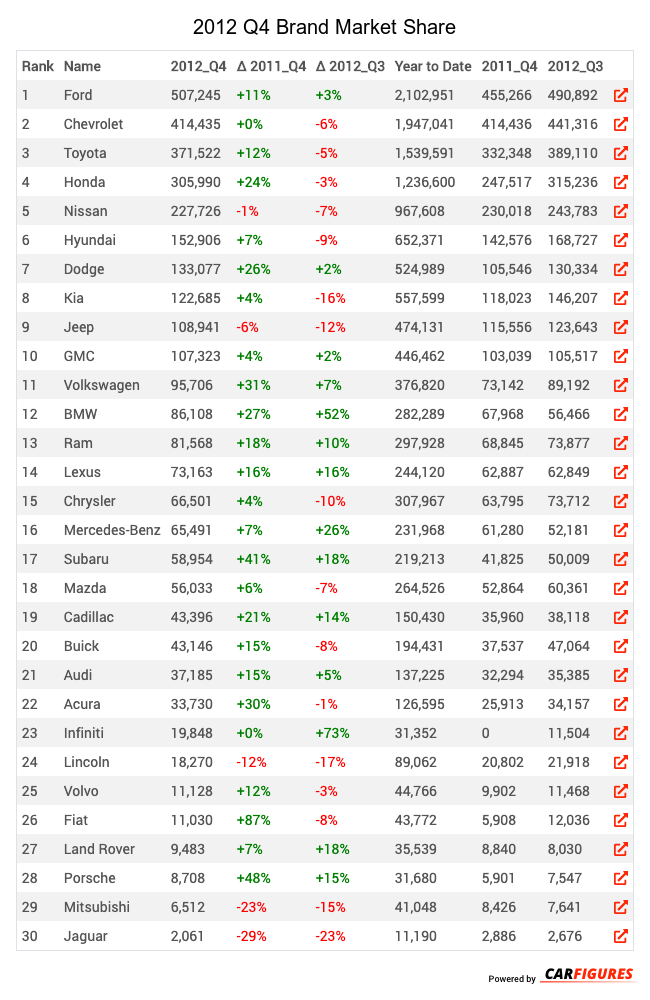
Rank Name 2012_Q4 Δ 2011_Q4 Δ 2012_Q3 Year to Date 2011_Q4 2012_Q3
1 Ford 507245 11 3 2102951 455266 490892
2 Chevrolet 414435 0 -6 1947041 414436 441316
3 Toyota 371522 12 -5 1539591 332348 389110
4 Honda 305990 24 -3 1236600 247517 315236
5 Nissan 227726 -1 -7 967608 230018 243783
6 Hyundai 152906 7 -9 652371 142576 168727
7 Dodge 133077 26 2 524989 105546 130334
8 Kia 122685 4 -16 557599 118023 146207
9 Jeep 108941 -6 -12 474131 115556 123643
10 GMC 107323 4 2 446462 103039 105517
11 Volkswagen 95706 31 7 376820 73142 89192
12 BMW 86108 27 52 282289 67968 56466
13 Ram 81568 18 10 297928 68845 73877
14 Lexus 73163 16 16 244120 62887 62849
15 Chrysler 66501 4 -10 307967 63795 73712
16 Mercedes-Benz 65491 7 26 231968 61280 52181
17 Subaru 58954 41 18 219213 41825 50009
18 Mazda 56033 6 -7 264526 52864 60361
19 Cadillac 43396 21 14 150430 35960 38118
20 Buick 43146 15 -8 194431 37537 47064
21 Audi 37185 15 5 137225 32294 35385
22 Acura 33730 30 -1 126595 25913 34157
23 Infiniti 19848 0 73 31352 0 11504
24 Lincoln 18270 -12 -17 89062 20802 21918
25 Volvo 11128 12 -3 44766 9902 11468
26 Fiat 11030 87 -8 43772 5908 12036
27 Land Rover 9483 7 18 35539 8840 8030
28 Porsche 8708 48 15 31680 5901 7547
29 Mitsubishi 6512 -23 -15 41048 8426 7641
30 Jaguar 2061 -29 -23 11190 2886 2676

Download Historic Sales Data
Looking for more data/visualizations? Send us an email at [email protected] for customized data aggregates and visualizations.