Last updated: January 10, 2022
Volvo Total Canada Sales Statistics by Year
Volvo Total Canada Sales Statistics by Quarter
Current Lineup
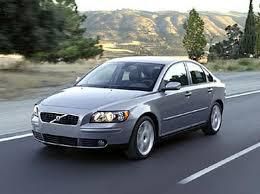
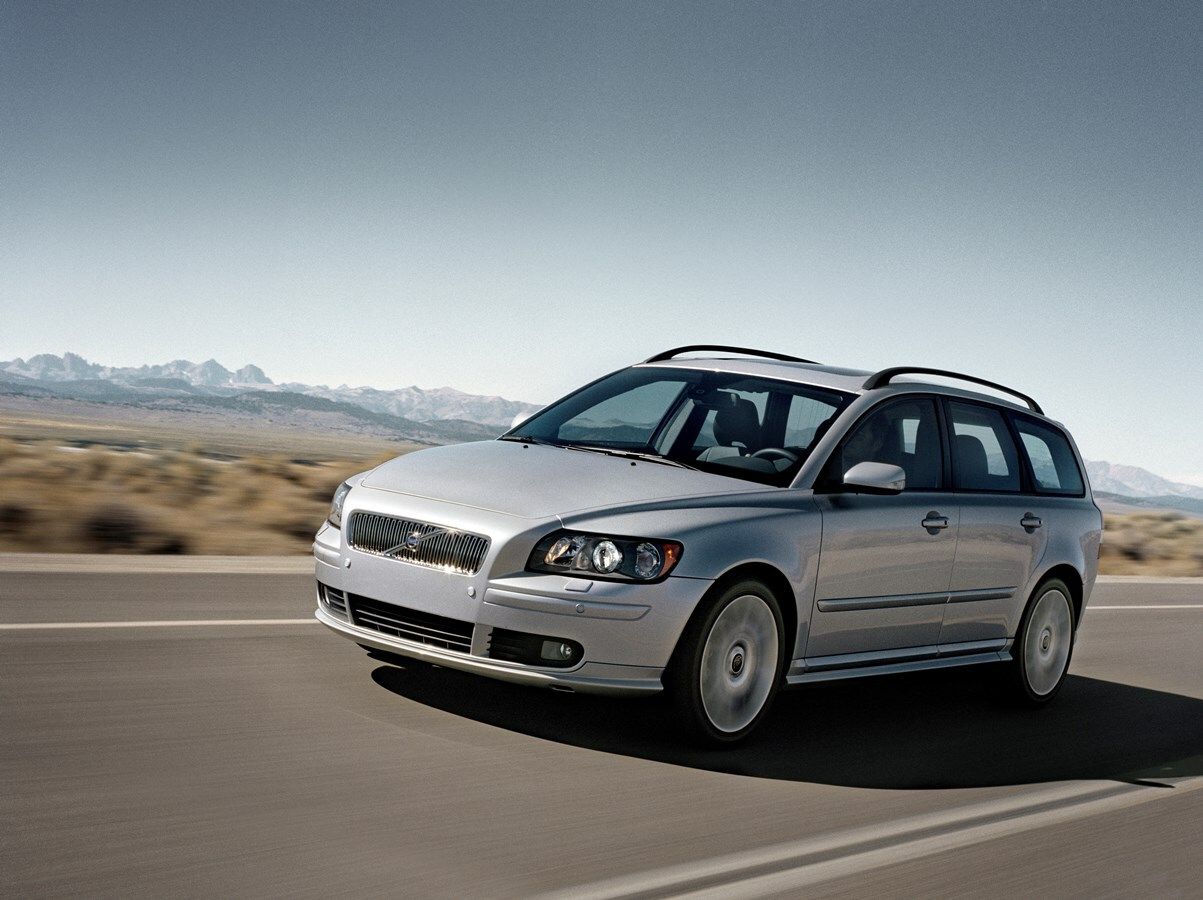
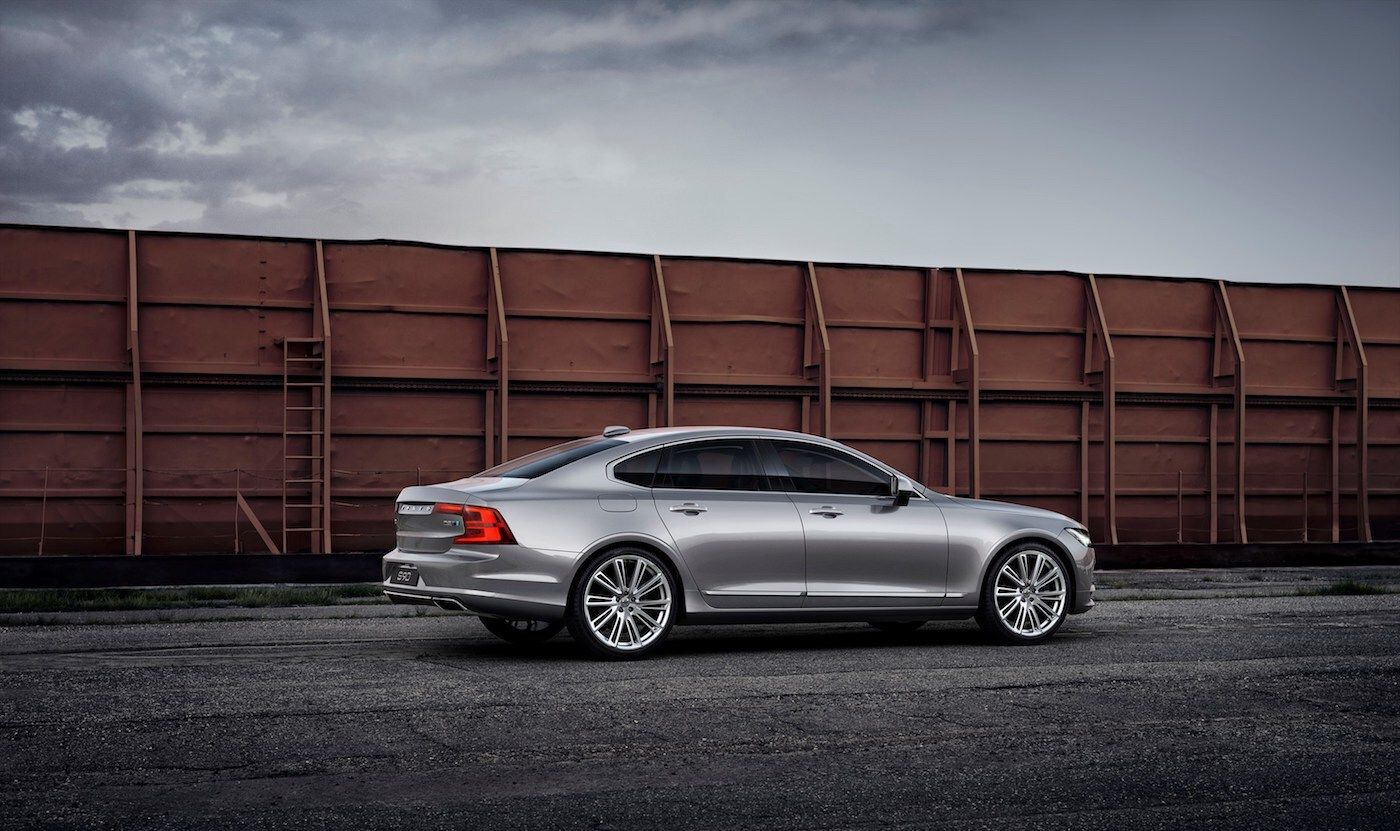
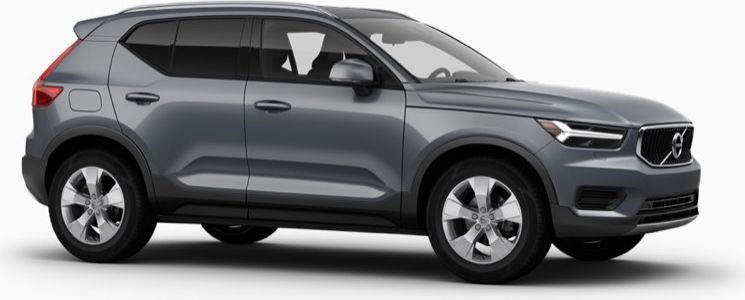
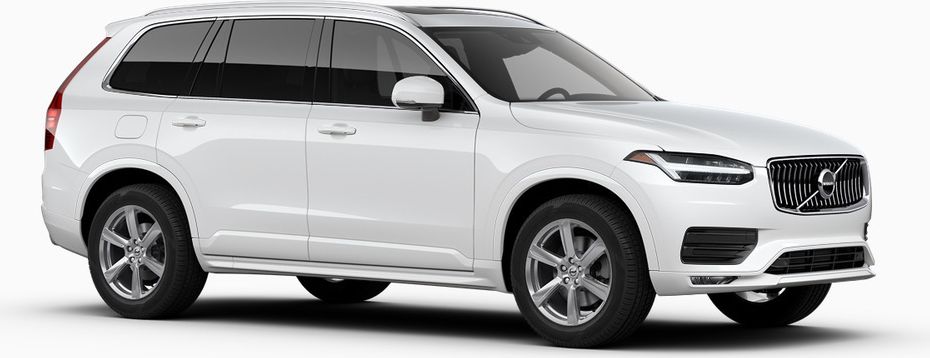
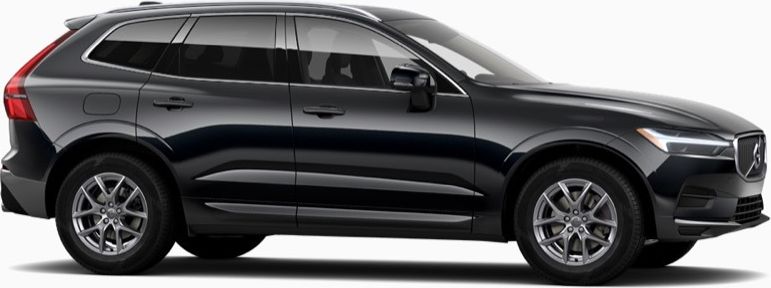
Volvo includes the cars 30 Series, 40 Series, 50 Series, 60 Series, 70 Series, 80 Series, 90 Series, 2024 XC40, 2024 XC60, 2024 XC90
Loading, please wait
Year | Q1 | Q2 | Q3 | Q4 |
|---|---|---|---|---|
| 2005 | 2,578 | 2,749 | 2,874 | 2,461 |
| 2006 | 2,372 | 3,167 | 2,328 | 1,683 |
| 2007 | 2,102 | 3,169 | 2,318 | 1,285 |
| 2008 | 1,423 | 2,470 | 1,420 | 1,194 |
| 2009 | 1,140 | 2,287 | 1,626 | 1,489 |
| 2010 | 1,411 | 1,991 | 1,770 | 1,379 |
| 2011 | 1,382 | 2,275 | 1,734 | 1,425 |
| 2012 | 1,353 | 2,078 | 1,231 | 916 |
| 2013 | 997 | 1,549 | 1,181 | 946 |
| 2014 | 1,000 | 1,453 | 1,024 | 989 |
| 2015 | 818 | 1,498 | 1,262 | 1,210 |
| 2016 | 1,258 | 1,859 | 1,611 | 1,375 |
| 2017 | 1,271 | 1,928 | 1,734 | 2,169 |
| 2018 | 1,817 | 2,744 | 2,508 | 2,148 |
| 2019 | 1,968 | 2,932 | 2,606 | 2,649 |
| 2020 | 2,020 | 1,689 | 3,119 | 3,009 |
| 2021 | 2,099 | 3,044 | 3,277 | 2,684 |
Loading, please wait
Year | Sales |
|---|---|
| 2021 | 11,104 |
| 2020 | 9,837 |
| 2019 | 10,155 |
| 2018 | 9,217 |
| 2017 | 7,102 |
| 2016 | 6,103 |
| 2015 | 4,788 |
| 2014 | 4,466 |
| 2013 | 4,673 |
| 2012 | 5,578 |
| 2011 | 6,816 |
| 2010 | 6,551 |
| 2009 | 6,542 |
| 2008 | 6,507 |
| 2007 | 8,874 |
| 2006 | 9,550 |
| 2005 | 10,662 |
| Total | 128,525 |


