Key Stats
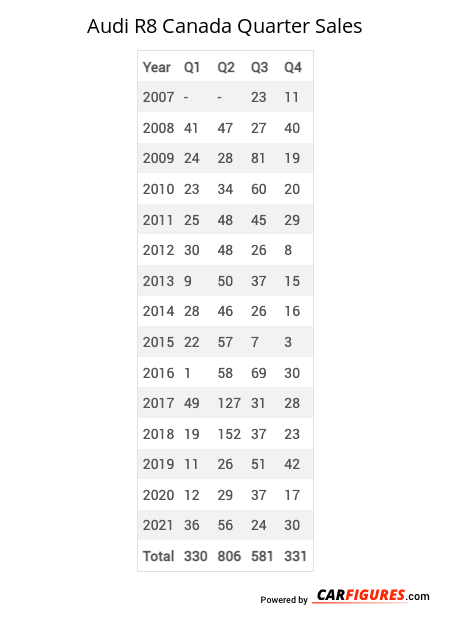
How many R8 did Audi sell in Q4 2021?
Audi sold 30 R8 in Q4 2021.
How many R8 did Audi sell in 2021?
Audi sold 146 R8 in 2021. In 2020, Audi sold 95 R8. They sold 51 more units in 2021 compared to 2020 with a percent gain of 53.68% YoY.
Overview
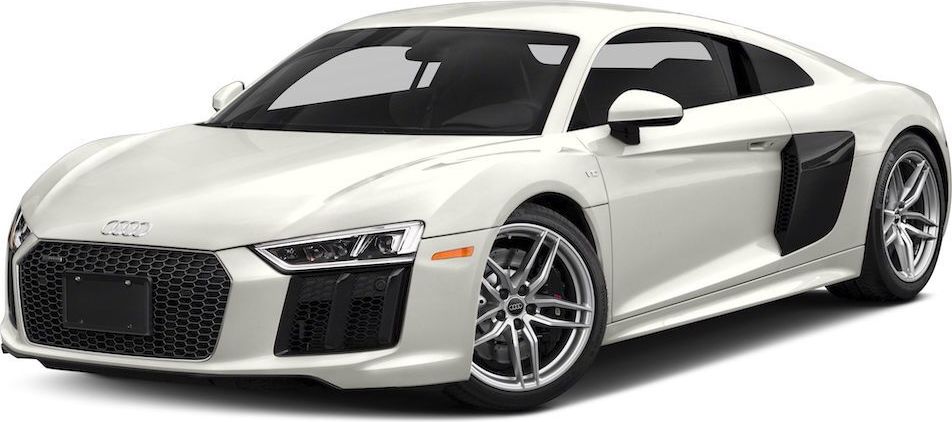
The 2017 Audi R8 weighs 1695 kg with room to seat up to 2 people.
How Much Does the 2017 Audi R8 Cost?
The 2017 Audi R8 starts at $184,000 MSRP. Fully loaded, the Audi R8 will cost you about $213,900.
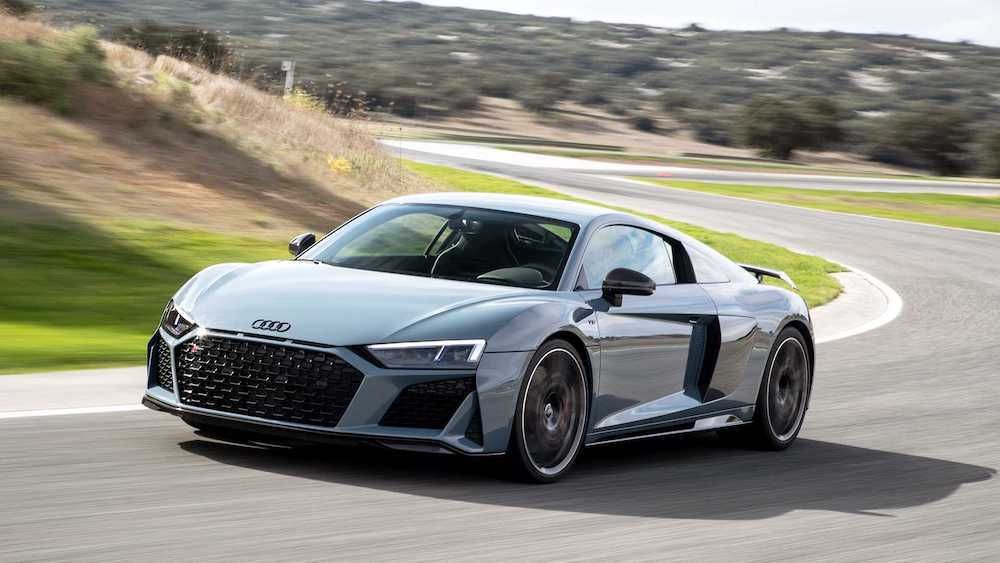
Audi R8 Engine, Transmission, and Performance Numbers
Audi R8 delivers 540 horsepower with 398 ft-lb torque delivered through a all-wheel-drive drivetrain.
2017 Audi R8 Fuel Economy
The 2017 Audi R8 is expected to get 11 L/100 km in the city, 11 L/100 km on the highway. The 2017 Audi R8 has a fuel tank capacity of 83 liters for a maximum range of kilometers.
List of Audi R8 Competitors
Some of Audi R8 competitors include the Acura NSX.
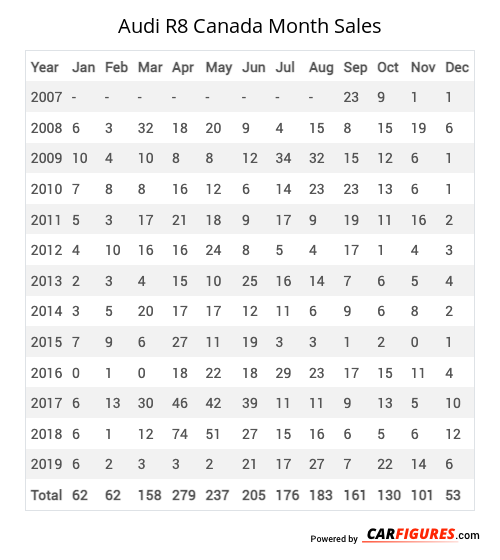
Audi R8 Canadian Sale figures by year, quarter, and month are presented below. Including the most up to date sales data for the Audi R8. See how the Audi R8 stacks up the other models in the Cars, Exotic Vehicles, Premium Sport/Performance Cars segments.
| Year | Jan | Feb | Mar | Apr | May | Jun | Jul | Aug | Sep | Oct | Nov | Dec |
|---|---|---|---|---|---|---|---|---|---|---|---|---|
| 2007 | - | - | - | - | - | - | - | - | 23 | 9 | 1 | 1 |
| 2008 | 6 | 3 | 32 | 18 | 20 | 9 | 4 | 15 | 8 | 15 | 19 | 6 |
| 2009 | 10 | 4 | 10 | 8 | 8 | 12 | 34 | 32 | 15 | 12 | 6 | 1 |
| 2010 | 7 | 8 | 8 | 16 | 12 | 6 | 14 | 23 | 23 | 13 | 6 | 1 |
| 2011 | 5 | 3 | 17 | 21 | 18 | 9 | 17 | 9 | 19 | 11 | 16 | 2 |
| 2012 | 4 | 10 | 16 | 16 | 24 | 8 | 5 | 4 | 17 | 1 | 4 | 3 |
| 2013 | 2 | 3 | 4 | 15 | 10 | 25 | 16 | 14 | 7 | 6 | 5 | 4 |
| 2014 | 3 | 5 | 20 | 17 | 17 | 12 | 11 | 6 | 9 | 6 | 8 | 2 |
| 2015 | 7 | 9 | 6 | 27 | 11 | 19 | 3 | 3 | 1 | 2 | 0 | 1 |
| 2016 | 0 | 1 | 0 | 18 | 22 | 18 | 29 | 23 | 17 | 15 | 11 | 4 |
| 2017 | 6 | 13 | 30 | 46 | 42 | 39 | 11 | 11 | 9 | 13 | 5 | 10 |
| 2018 | 6 | 1 | 12 | 74 | 51 | 27 | 15 | 16 | 6 | 5 | 6 | 12 |
| 2019 | 6 | 2 | 3 | 3 | 2 | 21 | 17 | 27 | 7 | 22 | 14 | 6 |
| Total | 62 | 62 | 158 | 279 | 237 | 205 | 176 | 183 | 161 | 130 | 101 | 53 |
| Year | Q1 | Q2 | Q3 | Q4 |
|---|---|---|---|---|
| 2007 | - | - | 23 | 11 |
| 2008 | 41 | 47 | 27 | 40 |
| 2009 | 24 | 28 | 81 | 19 |
| 2010 | 23 | 34 | 60 | 20 |
| 2011 | 25 | 48 | 45 | 29 |
| 2012 | 30 | 48 | 26 | 8 |
| 2013 | 9 | 50 | 37 | 15 |
| 2014 | 28 | 46 | 26 | 16 |
| 2015 | 22 | 57 | 7 | 3 |
| 2016 | 1 | 58 | 69 | 30 |
| 2017 | 49 | 127 | 31 | 28 |
| 2018 | 19 | 152 | 37 | 23 |
| 2019 | 11 | 26 | 51 | 42 |
| 2020 | 12 | 29 | 37 | 17 |
| 2021 | 36 | 56 | 24 | 30 |
| Total | 330 | 806 | 581 | 331 |
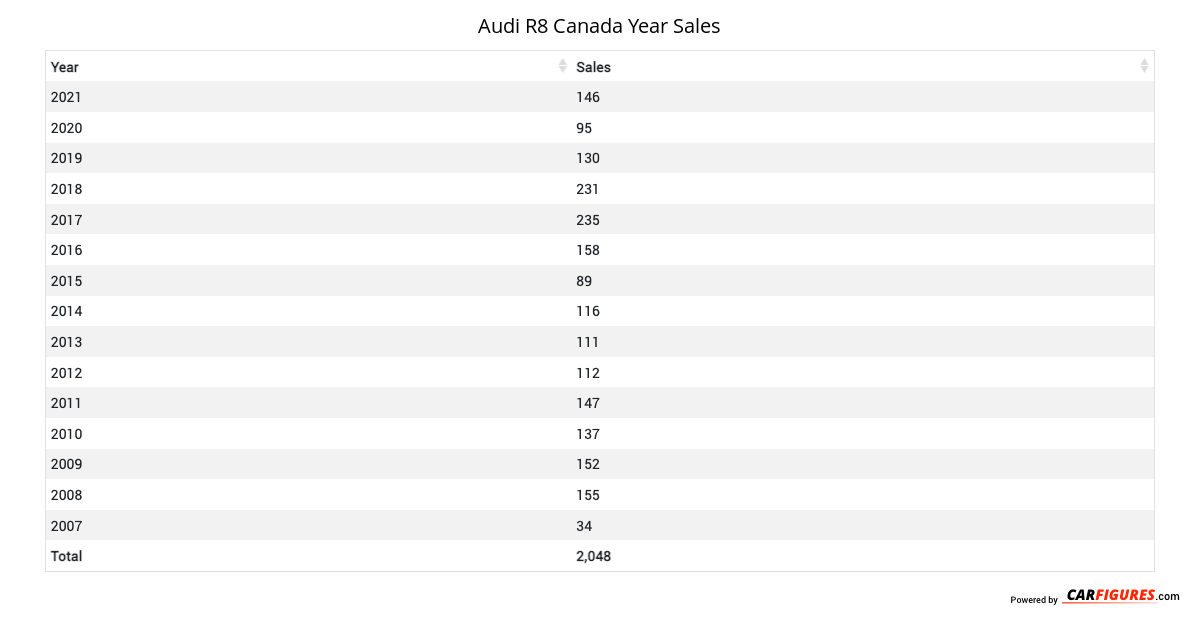
| Year | Sales |
|---|---|
| 2021 | 146 |
| 2020 | 95 |
| 2019 | 130 |
| 2018 | 231 |
| 2017 | 235 |
| 2016 | 158 |
| 2015 | 89 |
| 2014 | 116 |
| 2013 | 111 |
| 2012 | 112 |
| 2011 | 147 |
| 2010 | 137 |
| 2009 | 152 |
| 2008 | 155 |
| 2007 | 34 |
| Total | 2048 |
Download Historic Sales Data
Embedded Code
See more widgetsSources: Manufacturers